
• 321835
| Product name | B-hPD-L1 plus/hTPBG MC38 |
|---|---|
| Catalog number | 321835 |
| Strain background | C57BL/6 |
| Aliases | CD274;5T4 |
| Tissue | Colon |
| Disease | Colon carcinoma |
| Species | Mouse |
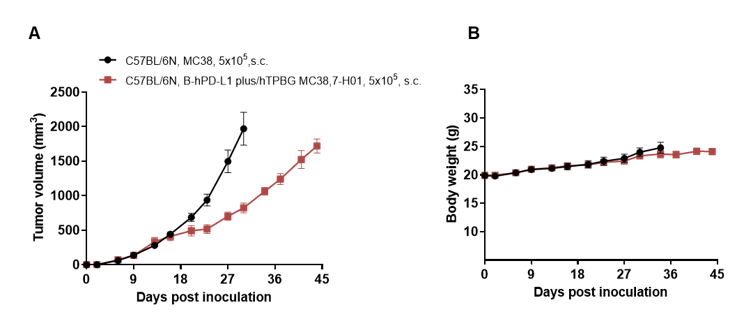
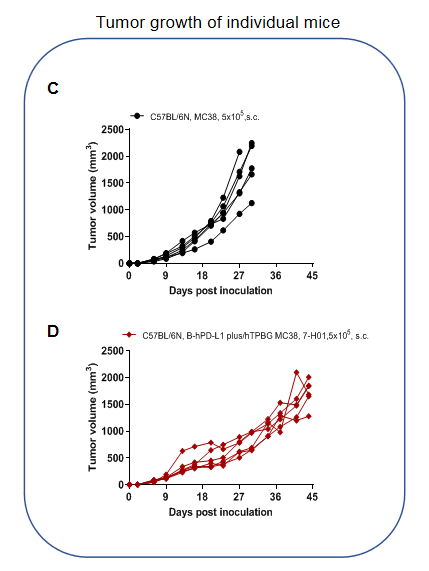
| Application | B-hPD-L1 plus/hTPBG MC38 cells have the capability to establish tumors in vivo and can be used for efficacy studies. |
on this page
The exogenous promoter and human PD-L1 CDS were inserted into the mouse Pd-l1 exon 3. The exogenous promoter and human TPBG CDS were inserted into mouse Tpbg locus site in B-hPD-L1 plus/hTPBG MC38. Human PD-L1 and TPBG are detected on the surface of B-hPD-L1 plus/hTPBG MC38 cells.
Gene targeting strategy for B-hPD-L1 plus/hTPBG MC38. The exogenous promoter and human PD-L1 CDS were inserted into the mouse Pd-l1 exon 3. The exogenous promoter and human TPBG CDS were inserted into mouse Tpbg locus site in B-hPD-L1 plus/hTPBG MC38.
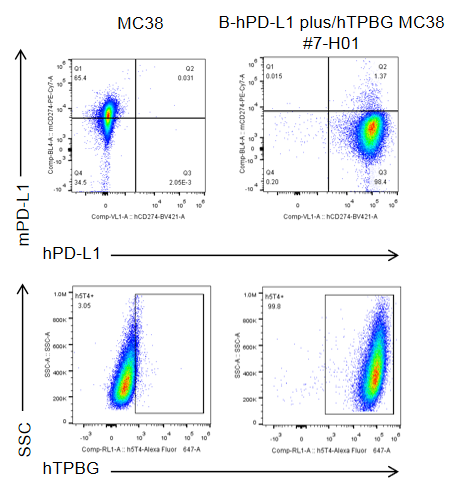
PD-L1 and TPBG expression analysis in B-hPD-L1 plus/hTPBG MC38 cells by flow cytometry. Single cell suspensions from B-hPD-L1 plus/hTPBG MC38 cultures were stained with anti-PD-L1 and anti-TPBG antibodies. Human PD-L1 and TPBG were detected on the surface of B-hPD-L1 plus/hTPBG MC38 cells.
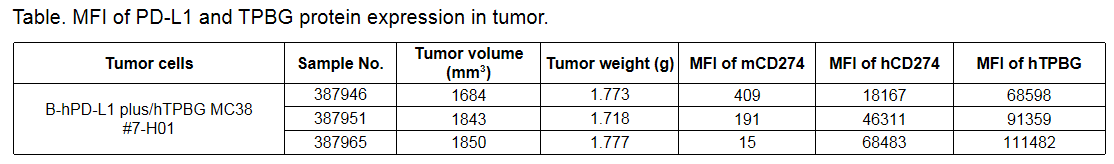
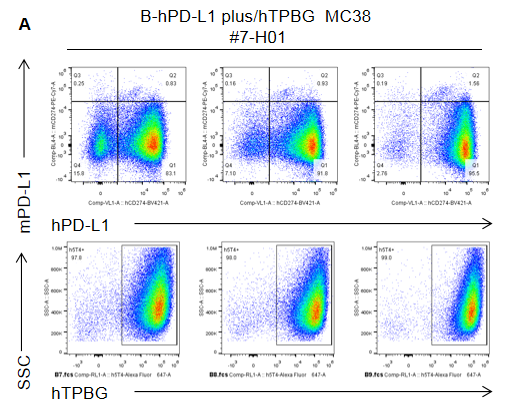
PD-L1 and TPBG expression analysis in tumor cells. Tumor cells were harvested at the end point of the experiment and assessed for m/hPD-L1 and hTPBG expression by flow cytometry. As shown in the panel A, human PD-L1 and TPBG were expressed on the surface of tumor cells. The MFI value was shown in the table.