Biocytogen has developed DSS mouse model, TNBS mouse model, and T cell transfer IBD mouse models, along with various IBD-related target humanized mice (e.g.B-hTL1A mice), for preclinical drug evaluation, complete with full datasets.
on this page
Inflammatory bowel disease (IBD), including ulcerative colitis (UC) and Crohn's disease (CD), is a chronic inflammatory disorder affecting the gastrointestinal tract. Clinical symptoms often include recurrent diarrhea, abdominal pain, intestinal bleeding /hematochezia, fever, and weight loss. Although the exact pathogenesis remains unclear, factors such as genetics, immune dysregulation, environmental triggers, and gut microbiota are all associated with disease development.
To study IBD mechanisms and evaluate treatment efficacy, researchers commonly use preclinical IBD mouse models. One of the most widely used models is chemically induced using dextran sulfate sodium (DSS)—the DSS colitis model. When DSS is administered through drinking water, it damages the intestinal epithelial barrier, activates non-specific immune cells to release cytokines, and disrupts mucosal integrity. These changes result in clinical and pathological features in mice—such as weight loss, loose stools, hematochezia, and granulocyte infiltration—that closely resemble human ulcerative colitis.
Biocytogen has developed a stable and reproducible DSS-induced IBD mouse model using C57BL/6 mice, providing a reliable tool for preclinical IBD research and pharmacodynamic evaluation of anti-inflammatory therapies. Biocytogen's humanized mouse models (e.g. B-hTL1A mice) for inflammatory bowel disease (IBD) stably express fully human TL1A protein, providing a precise preclinical testing platform for drug development that is relevant to human IBD.
| Mice strains |
| B-hCXCR2 |
| B-hTL1A |
| B-hTL1A/IL23A/IL12B |
| Readout | ||
| Included tests | Clinical scores | Body weight |
| DAI score | ||
| Colon | Colon length | |
| Colon weight | ||
| Histopathology | H&E | |
| Optional tests | Tissue homogenate | Cytokines test |
| Tissue histopathology | IHC | |
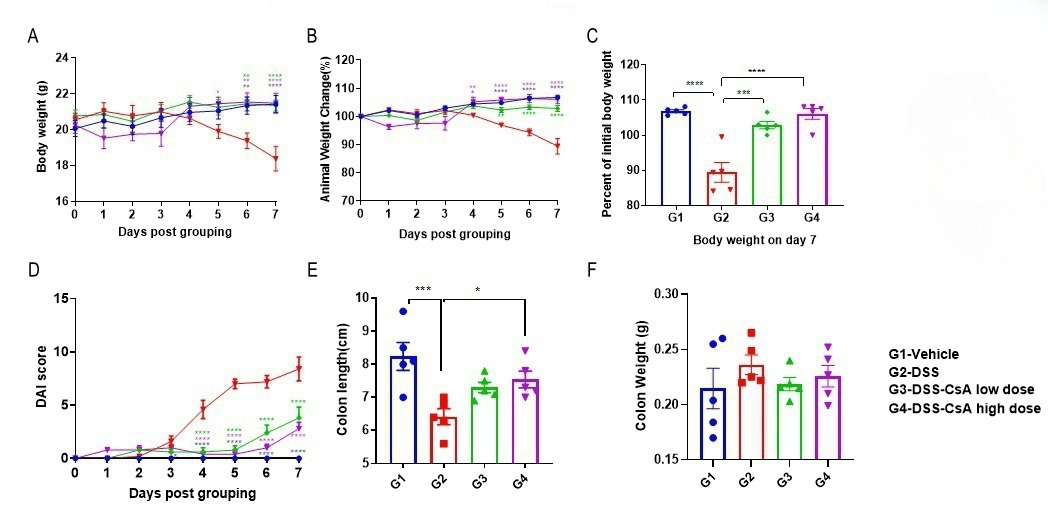
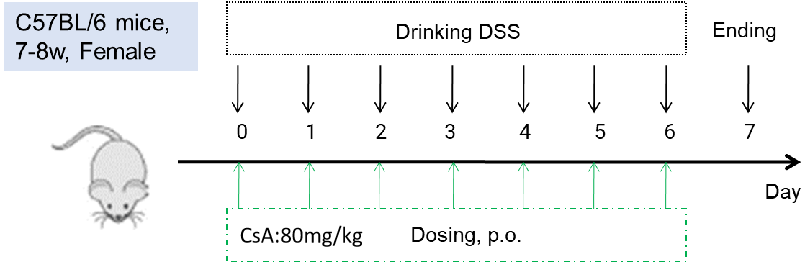
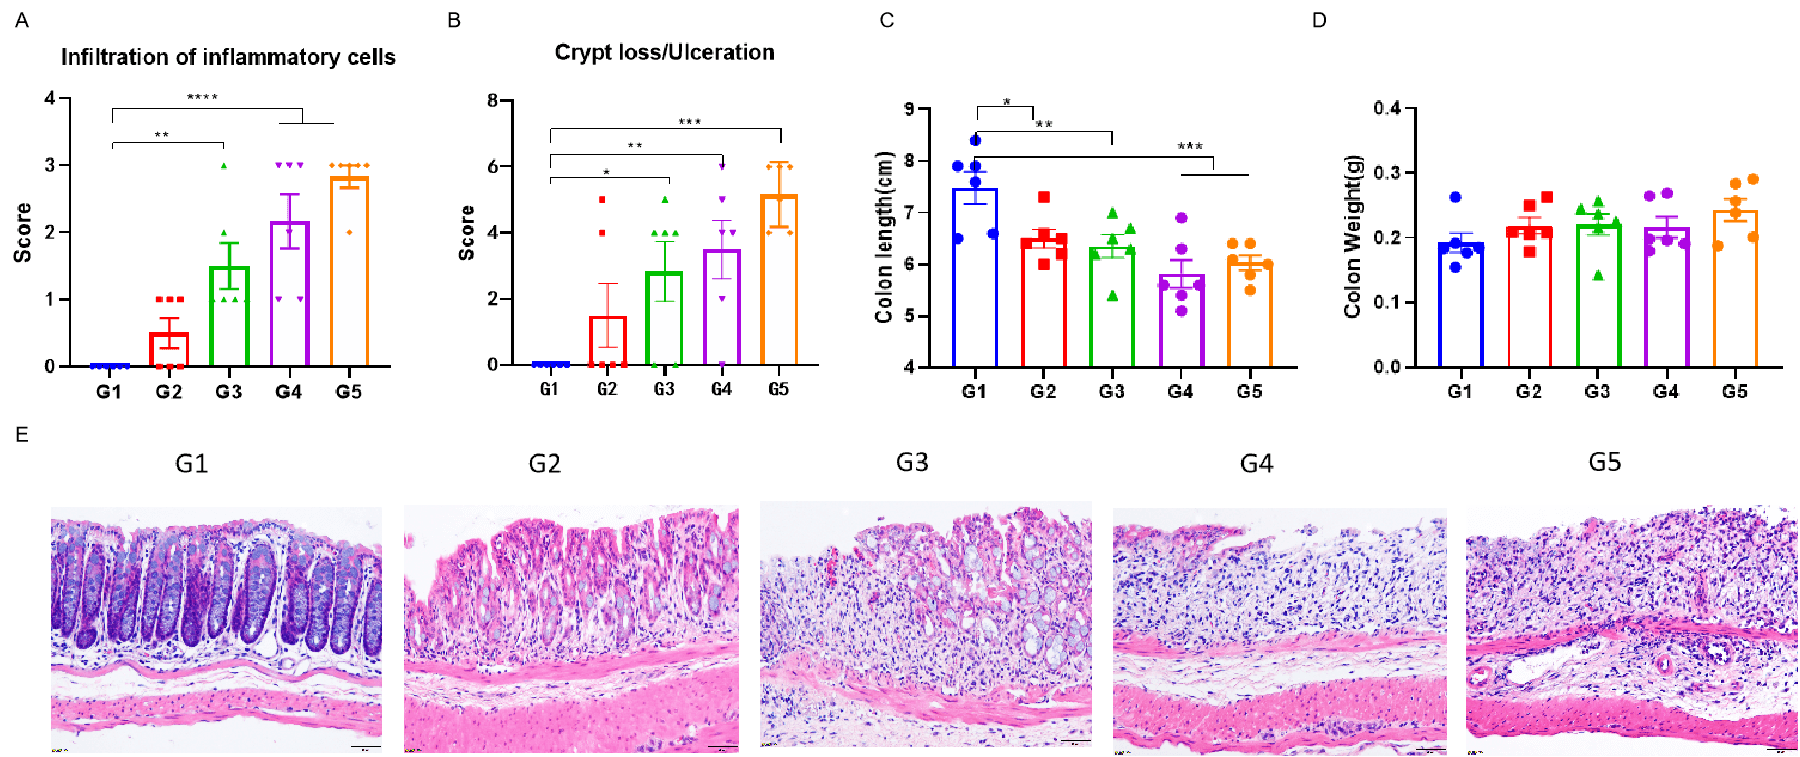
Efficacy validation on IBD mouse models for CsA (cyclosporin A). C57BL/6 mice were provided drinking water containing DSS for 7 consecutive days, and body weight changes were recorded throughout and scored clinically (A-D) at study endpoint, the colon weight and colon length were recorded. Two way-ANOVA (A-D) or one way ANOVA (E-F) followed by multiple comparison. Values are expressed as mean ± SEM. ****p<0.0001, ***p<0.001 , **p<0.01 , *p<0.05.
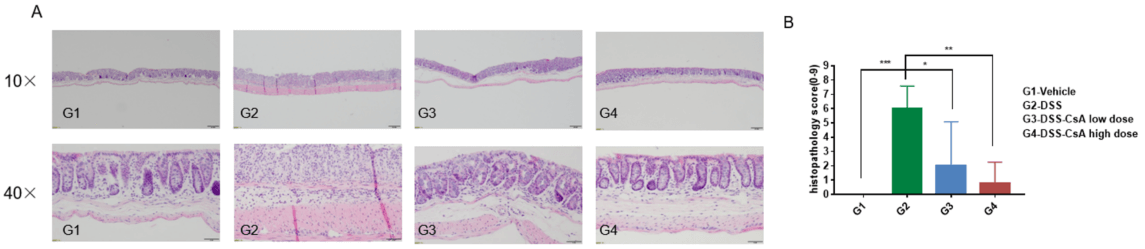
Histologic assessment of DSS-induced colitis in IBD mouse models. Photomicrographs of histopathological score and H&E staining cross-sections (10x and 40x magnification). Values are expressed as mean ± SEM. ****p<0.0001, ***p<0.001 , **p<0.01 , *p<0.05
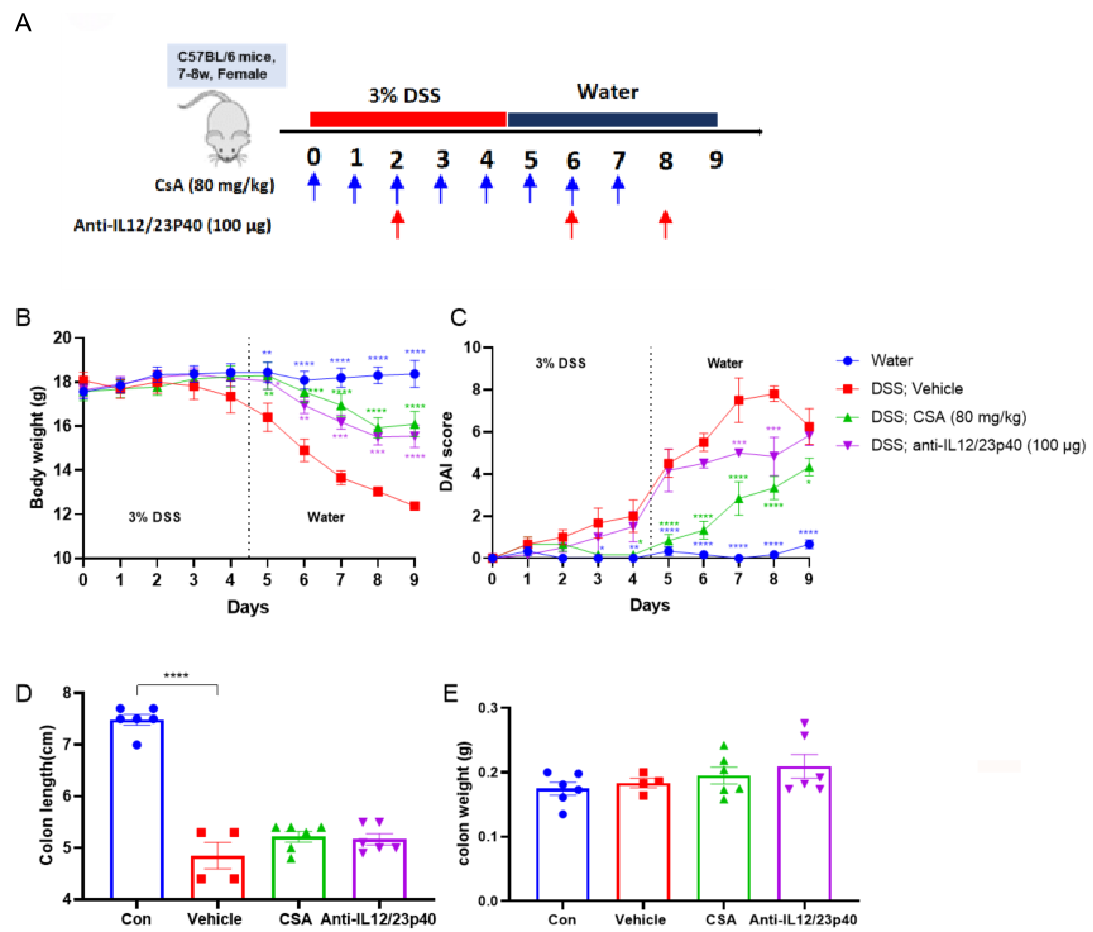
Effects of anti-IL12/23p40 on DSS-induced acute colitis.
C57BL/6 mice received 3% DSS in drinking water for 5 days, CsA was injected to mice every day from day0 to day7, anti-IL12/23P40 was administered to mice on day2, day 6 and day 8 (A). Body weight and excreta were recorded every day(B, C). At the end, colon was collected for H&E staining, colon length (D) and weight (E) were recorded. CsA and anti-IL12/23p40 alleviated 3% DSS induced ulcerative colitis in this experiment. Two way-ANOVA followed by multiple comparison. Values are expressed as mean ± SEM. ****p<0.0001, ***p<0.001 , **p<0.01 , *p<0.05.
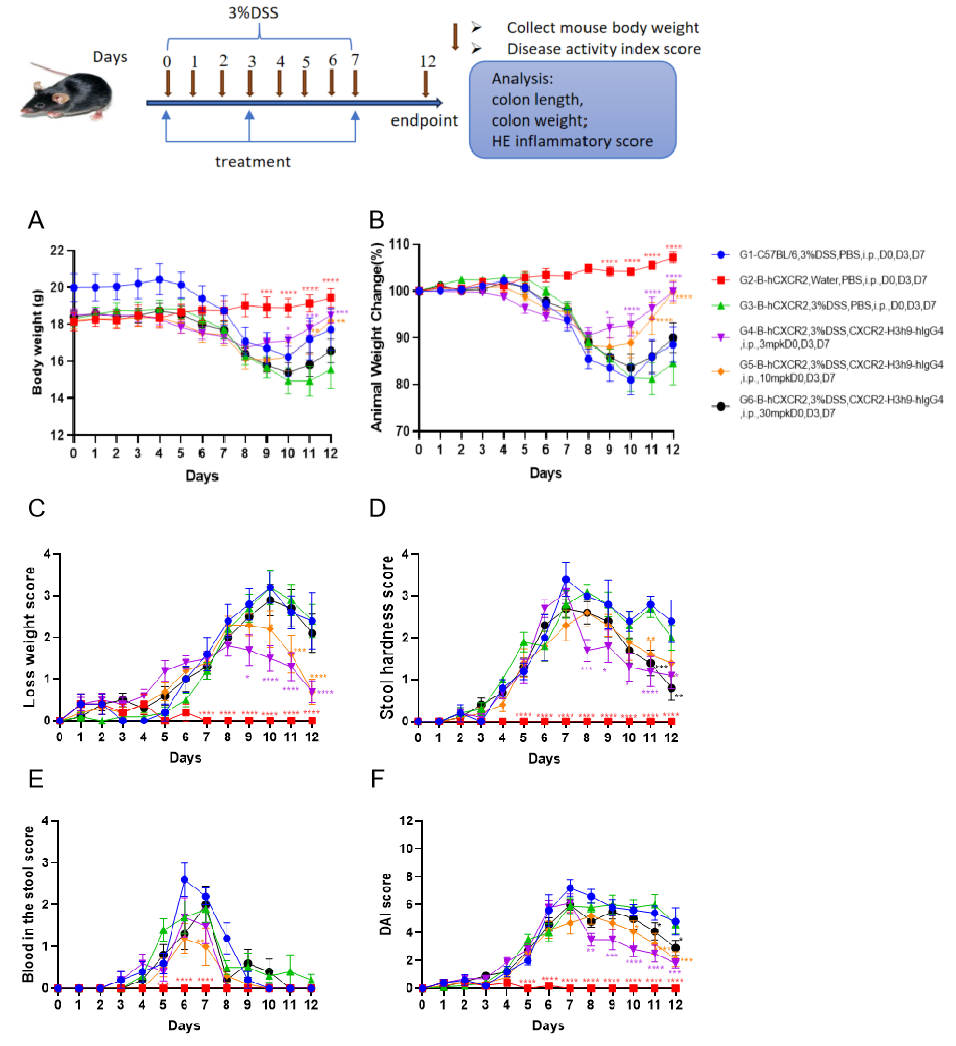
Efficacy validation on IBD(B-hCXCR2 mice) mouse models
C57BL/6 mice and B-hCXCR2 mice were provided drinking water containing DSS for 7 consecutive days, after which normal drinking water resumed. Body weight changes and clinical scores ( Weight loss score, stool hardness score, blood in stool score as well as total DAI score) were recorded throughout. Two way-ANOVA followed by multiple comparison, all group compared with G3. Values are expressed as mean ± SEM. ****p<0.0001, ***p<0.001 , **p<0.01 , *p<0.05.
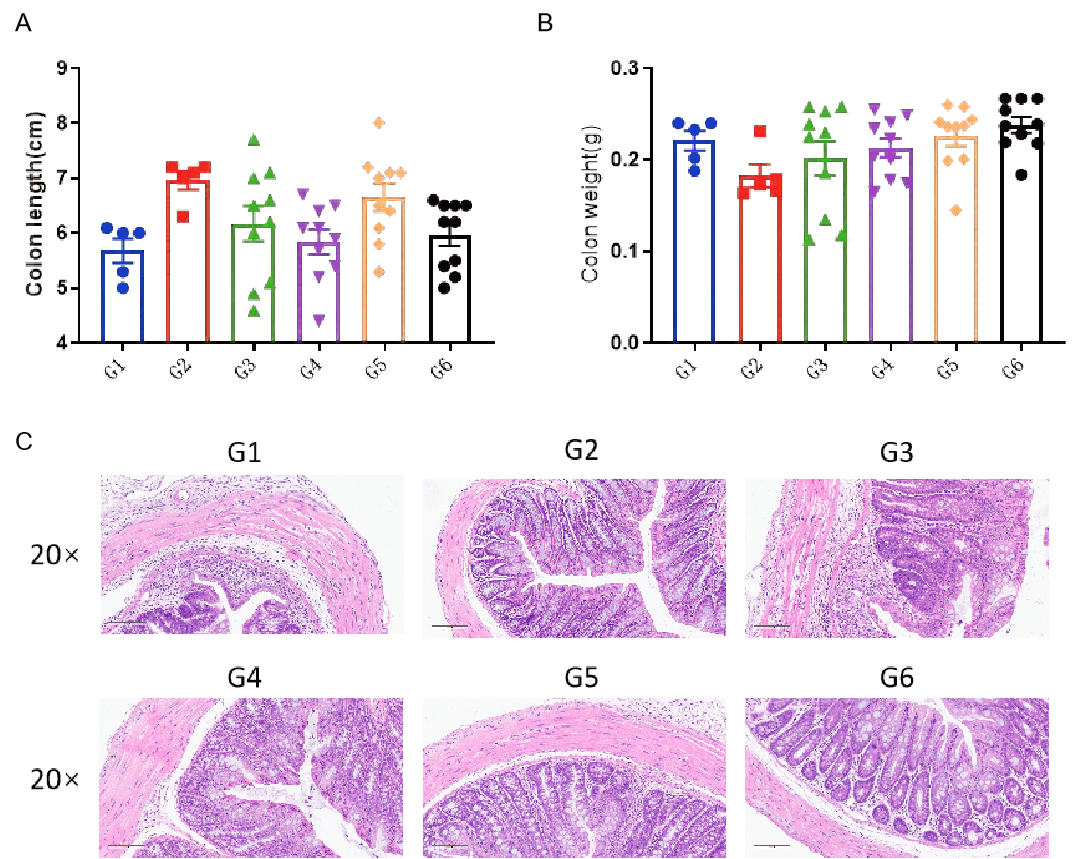
Gross sampling and colon evaluation and histologic assessment of the colon of IBD mouse model. C57BL/6 mice and B-hCXCR2 mice were provided drinking water containing DSS for 7 consecutive days, after which normal drinking water resumed. At study endpoint, colon length (A) and colon weight (B) were measured. Colon tissue were used for H&E staining (C). One-way ANOVA followed by multiple comparison, all group compared with G3. Values are expressed as mean ± SEM.
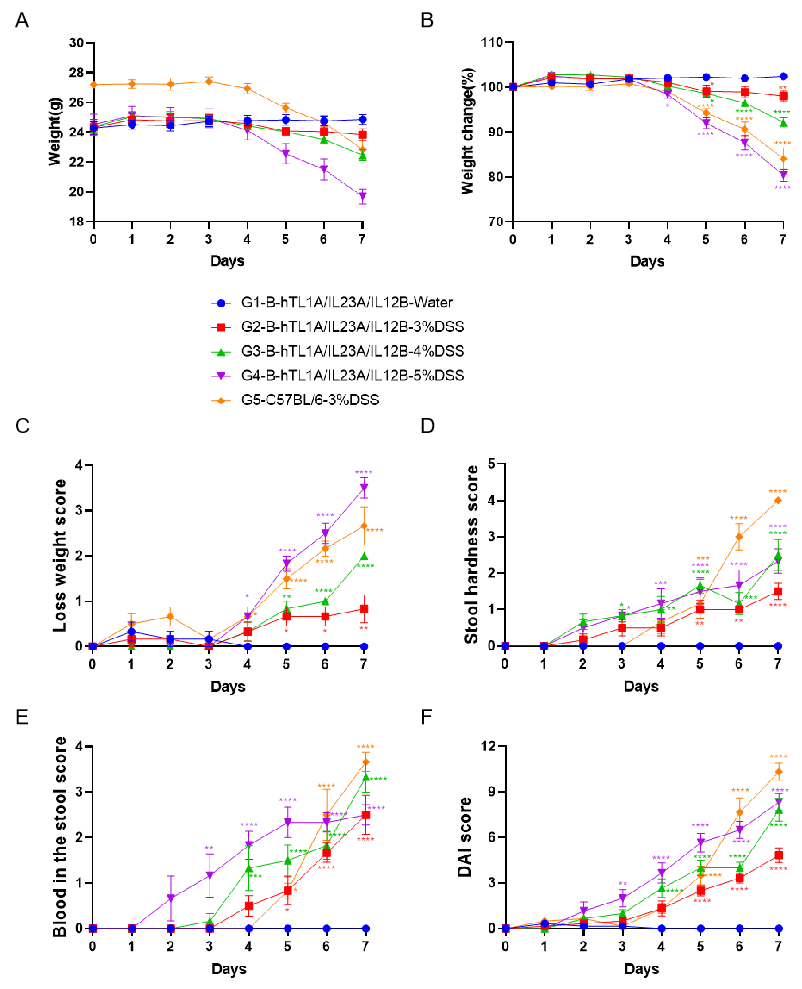
C57BL/6 mice and B-hTL1A/IL23A/IL12B mice were provided drinking water containing different concentration of DSS for 7 consecutive days. Body weight changes and clinical scores (Weight loss score, stool hardness score, blood in stool score as well as total DAI score) were recorded throughout. Two way-ANOVA followed by multiple comparison, all group compared with G1. Values are expressed as mean ± SEM. ****p<0.0001, ***p<0.001 , **p<0.01 , *p<0.05.
C57BL/6 mice and TL1A/IL23A/IL12B humanized mice (B-hTL1A/IL23A/IL12B mice) were provided drinking water containing different concentration of DSS for 7 consecutive days. At study endpoint, colon length and colon weight were measured. And colon tissue were used for H&E staining. One way ANOVA followed by multiple comparison compared to G1. Values are expressed as mean ± SEM. ****p<0.0001, ***p<0.001 , **p<0.01 , *p<0.05.
| Mice strains |
| B-hTL1A |
| Readout | ||
| Included tests | Clinical scores | Body weight |
| DAI score | ||
| Colon | Colon length | |
| Colon weight | ||
| Histopathology | HE | |
| Sirius Red staining | ||
| Optional tests | Tissue homogenate | Cytokines test |
| Tissue histopathology | IHC | |
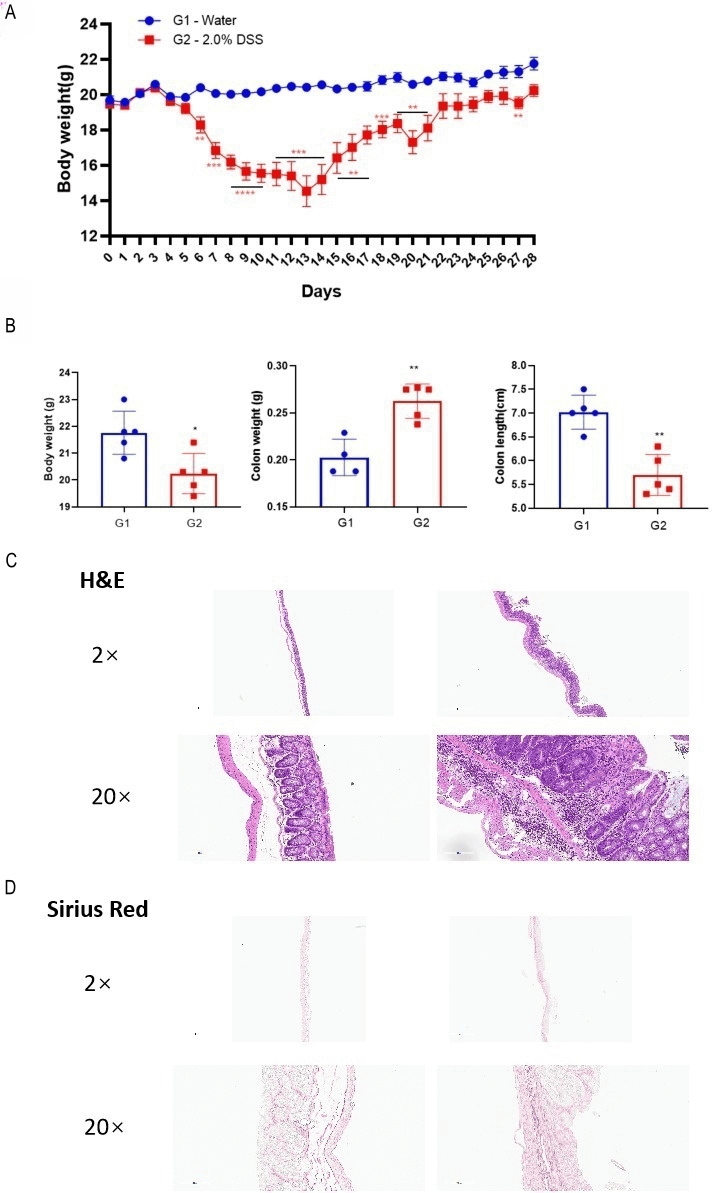
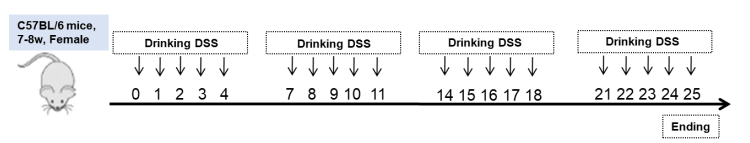
DSS induced chronic colitis. Mice were repeatedly exposed to 4 cycles of DSS. Each cycle contained 2% DSS for 5 days, followed by water for the next 2 days (A). Body weight, colon weight and colon length were recorded (B). Histopathological staining by H&E (C) and Sirius Red (D). Colon was collected for histology analysis. Mice received DSS showed lower body weight, higher colon weight and shorter colon length than mice received water. Multiple T-test. Mean ±SEM, n=5, ****p<0.0001, ***p<0.001 , **p<0.01 , *p<0.05.
| Mice strains |
| B-hTL1A |
| Readout | ||
| Included tests | Clinical scores | Body weight |
| Colon | Colon length | |
| Colon weight | ||
| Histopathology | HE | |
| Optional tests | Tissue homogenate | Cytokines test |
| Tissue histopathology | IHC | |
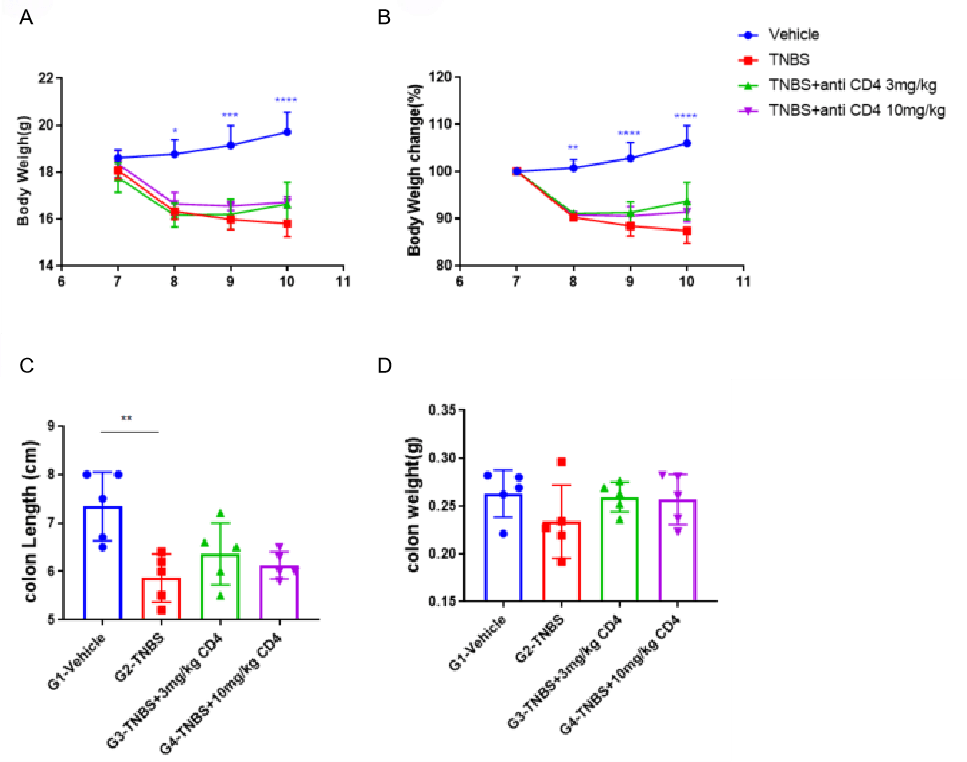
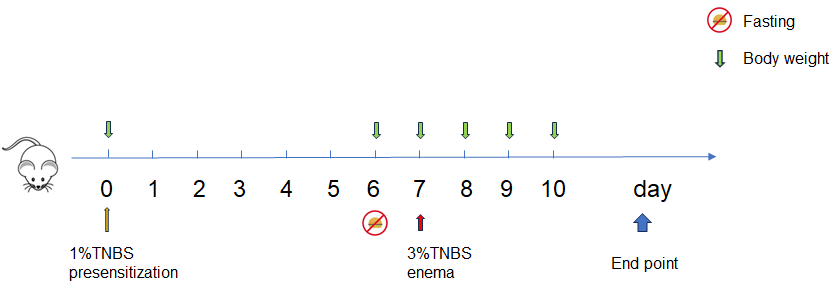
Effects of CD4-GK1.5-mlgG2a on TNBS-induced acute intestinal inflammation. Animals were presensitized with TNBS solution on shaved skin area on day 0, and then received TNBS intrarectal administration on day 7. Body weight (A) and body weight change (B) were recoded every day, CD4-GK1.5-mlgG2a (3, 10 mg/kg, i.p.) were administered on day 6. Mice were sacrificed on day 10 and colon length (C) and weight (D) were recorded. Two-way ANOVA or One-way ANOVE followed with Dunnett multiple comparisons, all groups compared with each other. Values are expressed as mean ± SEM. ****p<0.0001, ***p<0.001, **p<0.01 , *p<0.05.
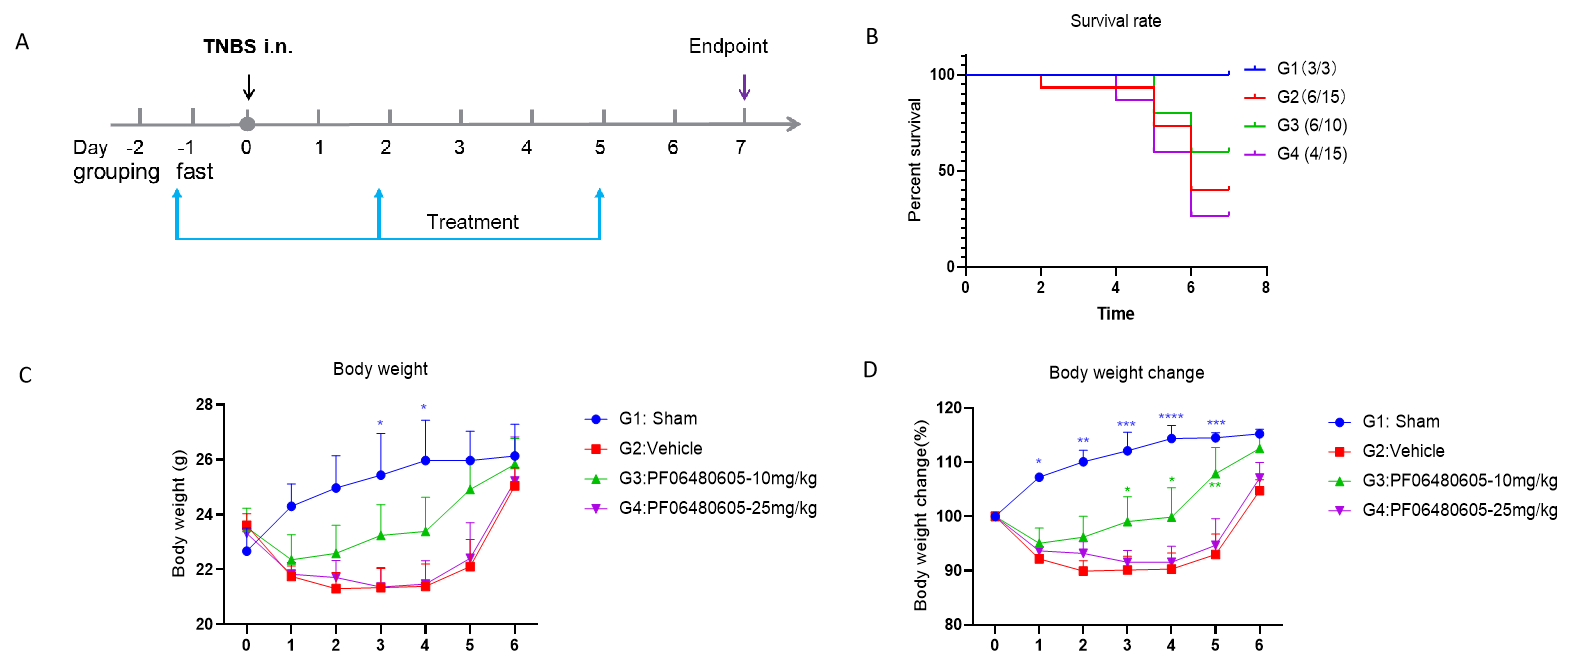
Efficacy of PF06480605 on TNBS-induced acute IBD on B-hTL1A mice. Animals received TNBS intrarectal administration on day 0. For TA administration, 10 of 25 mg/Kg PF06480605 were administered on day -1, day 2 and day 5. Schematic diagram of the scheme (A). Survival rates (B) were calculated and body weight (C-D) were recorded every day. Two-way ANOVA followed with Dunnett multiple comparisons, all groups compared G2. Values expressed as mean ± SEM. ****p<0.0001, ***p<0.001, **p<0.01 , *p<0.05.
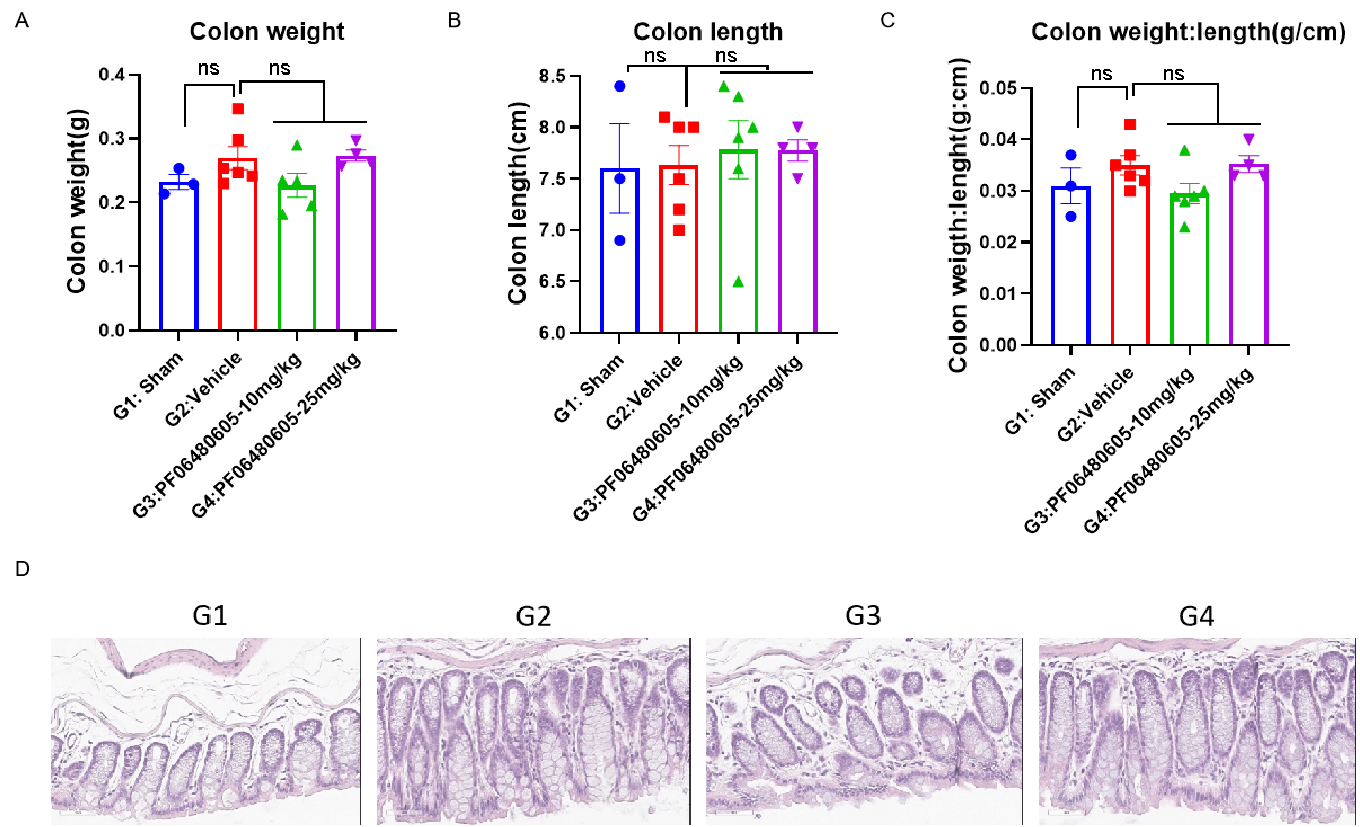
Animals received TNBS intrarectal administration on day 0. Body weight were recorded every day and survival rates were calculated. For TA administration, 10 of 25 mg/Kg PF06480605 were administered on day -1, day 2 and day 5. On day 7, mice were sacrificed and colon weight (A) and length (B) were recorded. Colon tissue was later used for H&E staining. One-way ANOVA followed with multiple comparisons. All groups compared with G2. Values expressed as mean ± SEM. ****p<0.0001, ***p<0.001, **p<0.01 , *p<0.05.
| Mice strains |
| B-hPSGL1(spleen donor) |
| Readout | ||
| Included tests | Clinical scores | Body weight |
| DAI score | ||
| Colon | Colon length | |
| Colon weight | ||
| Histopathology | H&E | |
| Optional tests | Tissue homogenate | Cytokines test |
| Tissue histopathology | IHC | |
| Histopathology | Sirius Red staining | |
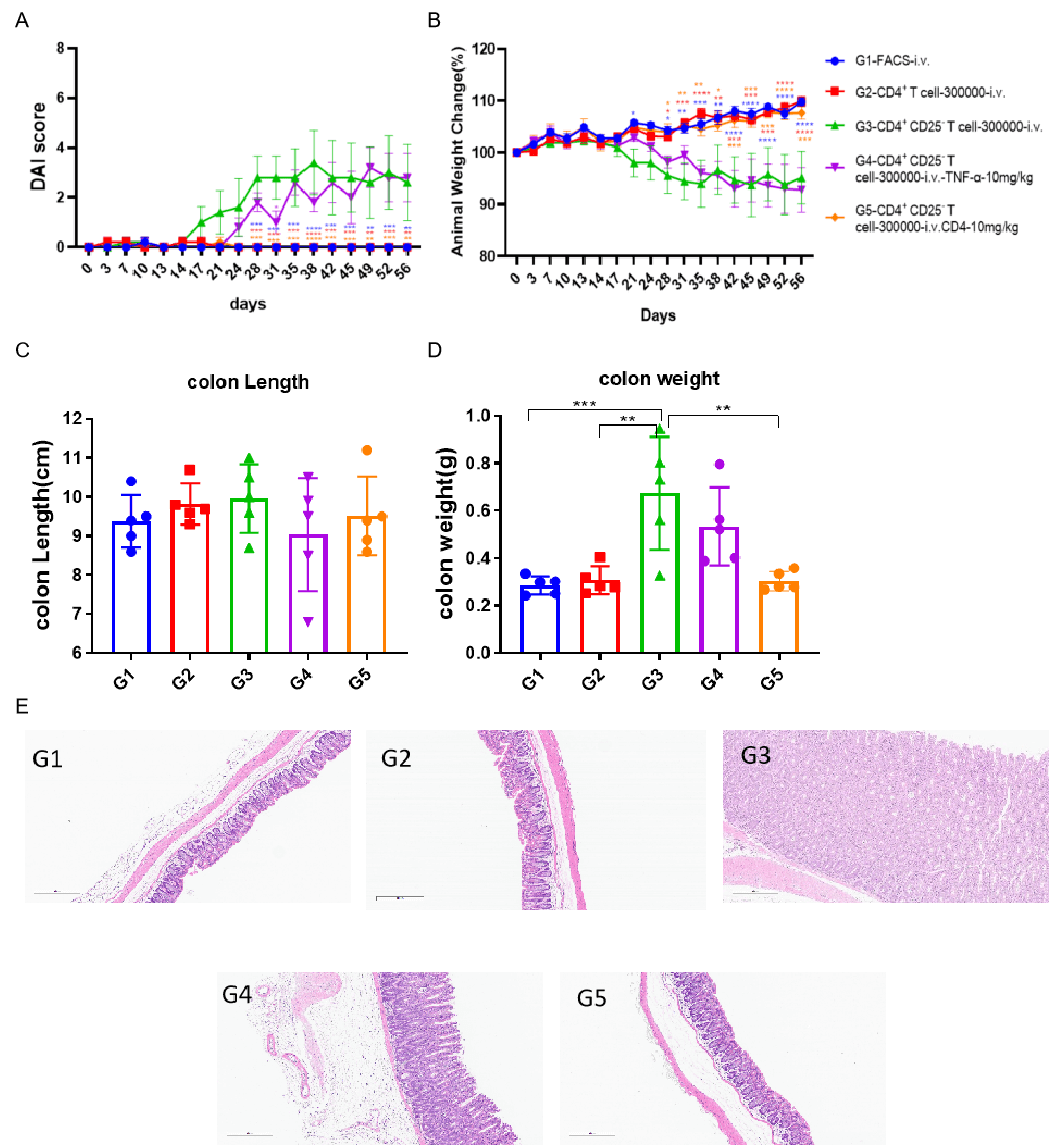
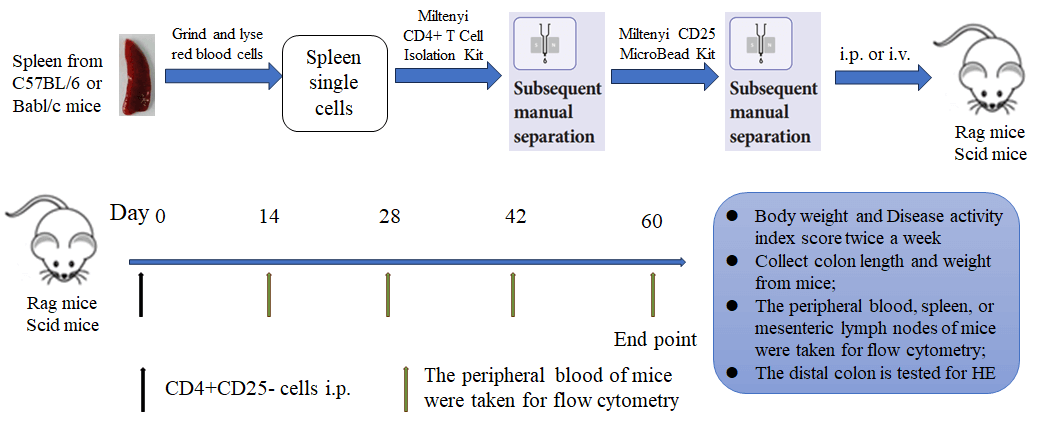
Efficacy of T cell transfer inducing IBD models.
The spleens of Balb/c mice were used to obtain CD4+CD25- T cells or CD4+ T cells using commercial kits. Animals in G2 received 3×10⁵ CD4+ T cells injection while animals G3-G5 received same quantity of CD4+CD25- T cells. For treatment, animals in G4 received weekly administration of 10 mg/kg anti-TNFα and animal in G5 received weekly administration of 10 mg/kg anti-CD4. Two-way ANOVA or One-way ANOVA followed with multiple comparison, Every group compared with G3. Values expressed as mean±SEM. ****p<0.0001, ***p<0.001, **p<0.01, *p<0.05.