

C57BL/6-Ifngr1tm1(IFNGR1)BcgenIfngtm1(IFNG)BcgenIfngr2tm1(IFNGR2)Bcgen/Bcgen • 130949
| Product name | B-hIFNGR1/hIFNG/hIFNGR2 mice |
|---|---|
| Catalog number | 130949 |
| Strain name | C57BL/6-Ifngr1tm1(IFNGR1)BcgenIfngtm1(IFNG)BcgenIfngr2tm1(IFNGR2)Bcgen/Bcgen |
| Strain background | C57BL/6 |
| Aliases | IFNG: IFG, IFI, IMD69,IFN-γIFNGR1: CD119, IFNGR, IMD27A, IMD27B; IFNGR2 also named AF-1; IFGR2; IMD28; IFNGT1 |
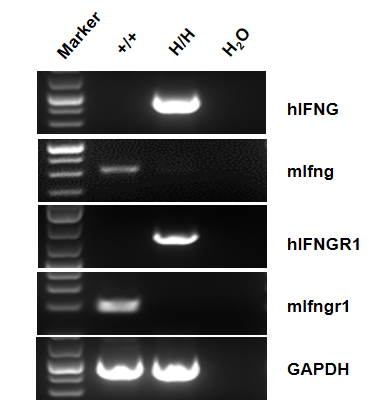
Gene targeting strategy for B-hIFNGR1/hIFNG/hIFNGR2 mice. The full coding sequence of mouse Ifng gene was replaced by counterpart of human IFNG gene in B-hIFNGR1/hIFNG/hIFNGR2 mice. The sequence that encoding the extracellular region of mouse Ifngr1 gene was replaced by counterpart human IFNGR1 gene in B-hIFNGR1/hIFNG/hIFNGR2 mice. The sequence that encoding the extracellular region of mouse Ifngr2 gene was replaced by counterpart human IFNGR2 gene in B-hIFNGR1/hIFNG/hIFNGR2 mice.
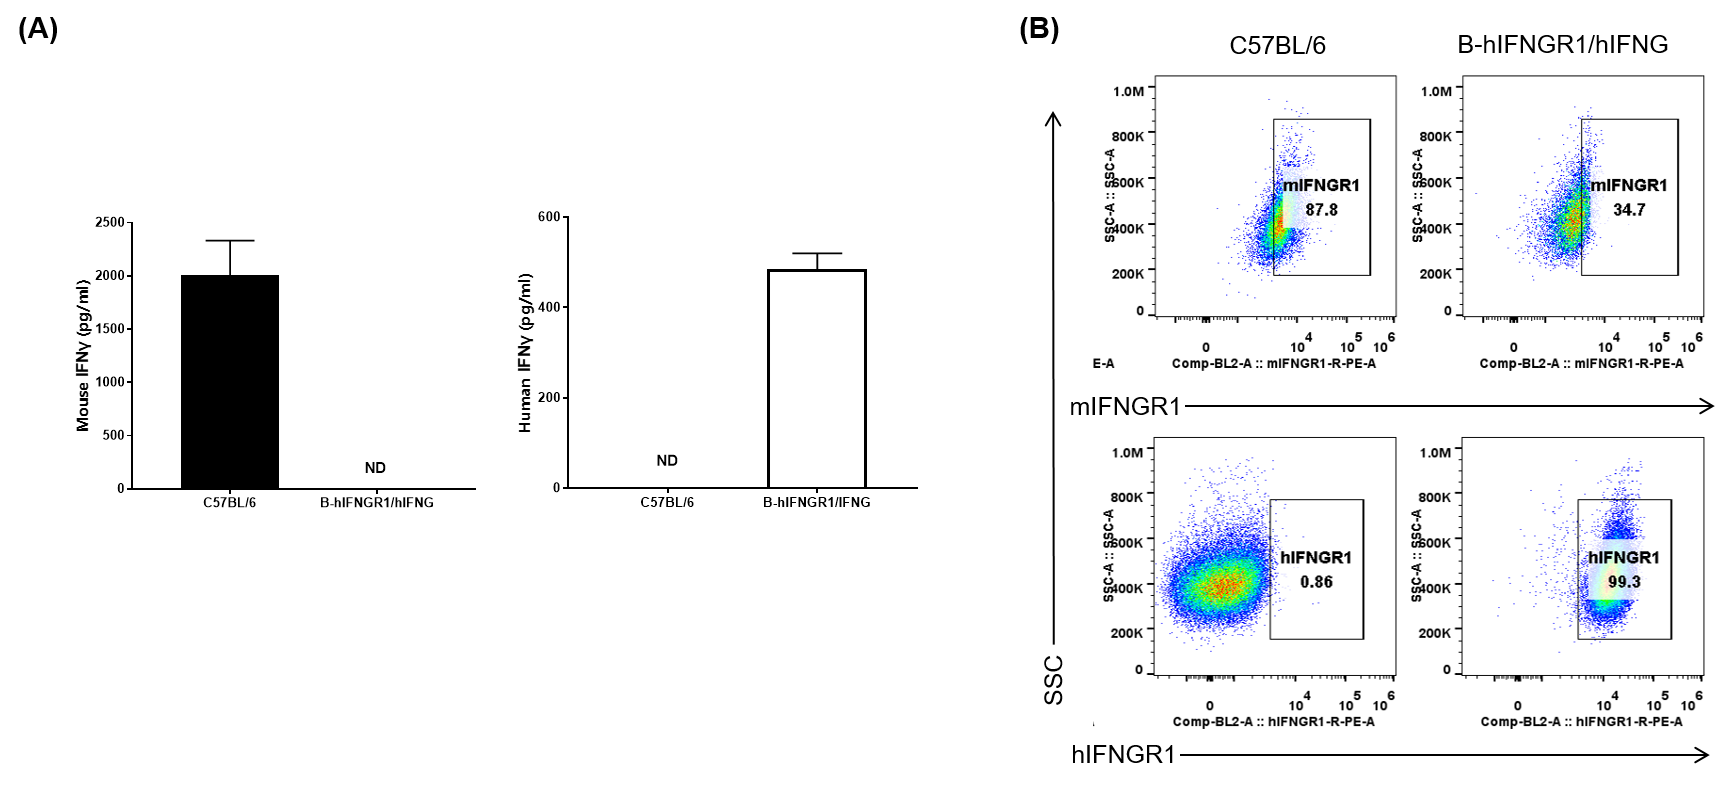
IFNG and IFNGR1 expression analysis in B-hIFNGR1/IFNG mice. (A) IFNG expression. Serum was collected from wild-type C57BL/6 mice and homozygous B-hIFNGR1/hIFNG mice (anti-CD3ε antibody, 2 hours, in vivo) and analyzed by ELISA with species-specific IFNG ELISA kit. Human IFNG was exclusively detectable in homozygous B-hIFNGR1/hIFNG mice but not in wild-type mice. (B) IFNGR1 expression. Peritoneal derived macrophage cells were collected, and analyzed by flow cytometry with anti-IFNGR1 antibody. Human IFNGR1 was detectable in B-hIFNGR1/hIFNG mice.
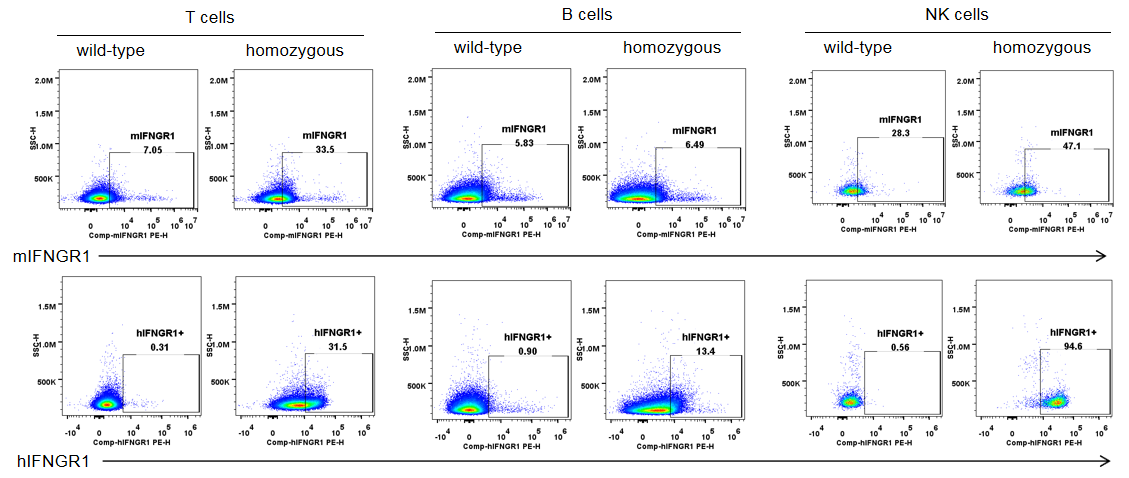
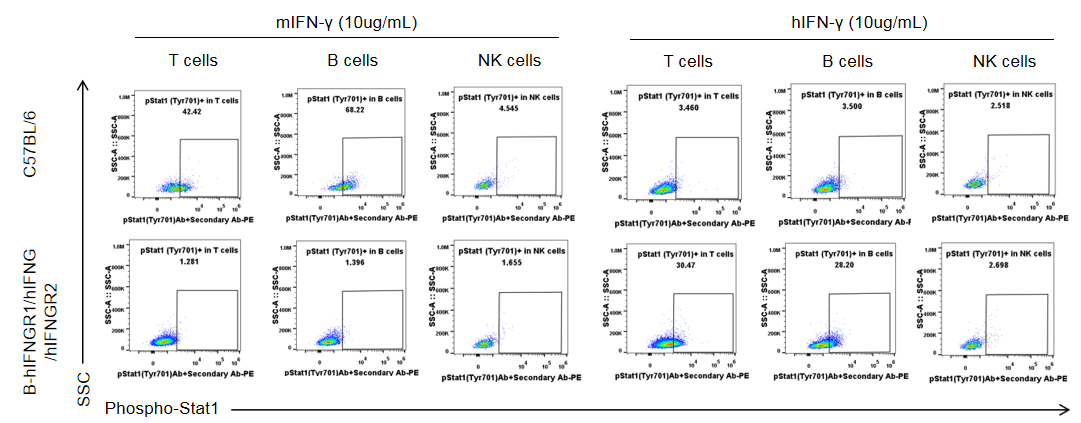
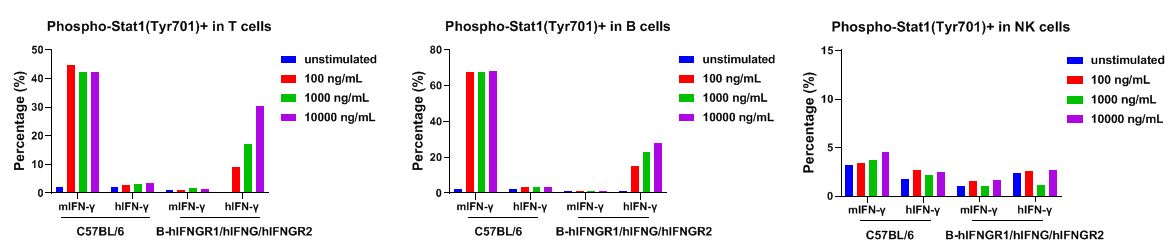
IFNGR1 expression analysis in B-hIFNGR1/IFNG/hIFNGR2 mice. Splenocytes were collected from wild-type C57BL/6 mice and homozygous B-hIFNGR1/hIFNG/hIFNGR2 mice, and analyzed by flow cytometry with anti-IFNGR1 antibody. Human IFNGR1 was detectable on T cells, B cells and NK cells of B-hIFNGR1/hIFNG/hIFNGR2 mice.
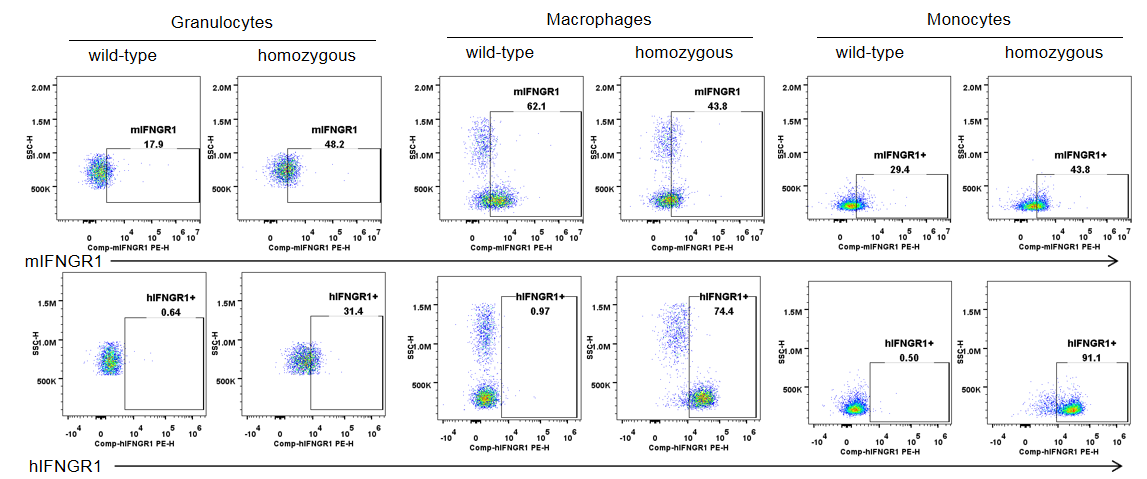
IFNGR1 expression analysis in B-hIFNGR1/hIFNG/hIFNGR2 mice. Splenocytes were collected from wild-type C57BL/6 mice and homozygous B-hIFNGR1/IFNG/hIFNGR2 mice, and analyzed by flow cytometry with anti-IFNGR1 antibody. Human IFNGR1 was detectable on granulocytes, macrophages and monocytes of B-hIFNGR1/hIFNG/hIFNGR2 mice.
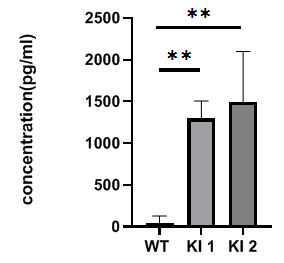
Analysis of hIFNγ production in activated splenocytes from homozygous B-hIFNGR1/hIFNG/hIFNGR2 mice (Triple-KI). Cells were seeded in a 96-wells plate for 0.5X10⁶ cells/well. The plate was precoated with 8μg/mL anti-mCD3 mAb at 4 ℃ for overnight. Then incubated the cells at 37℃ 5% CO2 for 5 days. Anti-CD28 at 1μg/mL and 100U hIL2 were added 16 hours after culture. Get the supernatant for ELISA analysis. hIFNγ was detection in triple-KI mice, but not in wild-type mice. *The experiment is verified by the cooperation partner.
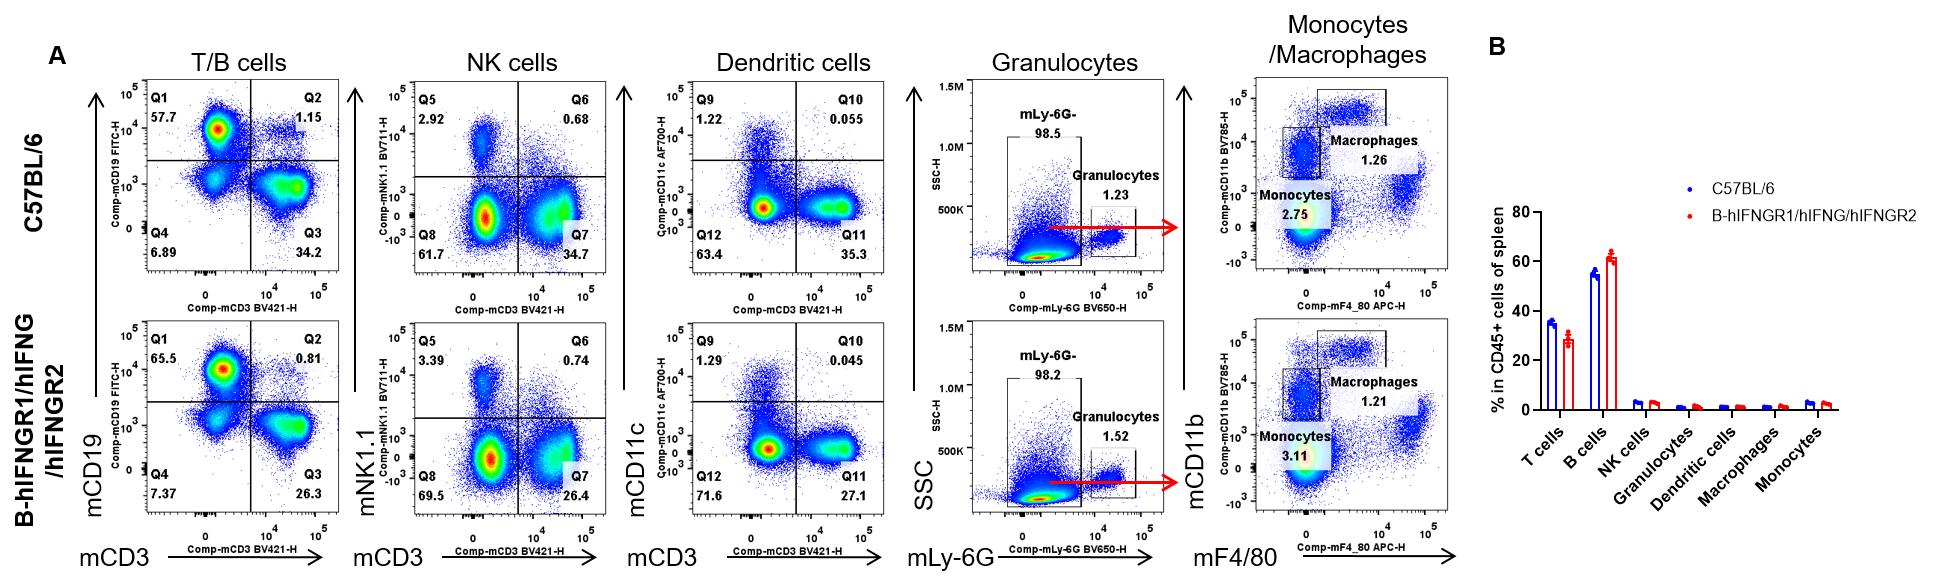
Analysis of spleen leukocyte subpopulations by flow cytometry. Splenocytes were isolated from female C57BL/6 and B-hIFNGR1/hIFNG/hIFNGR2 mice (n=3, 14-week-old). Flow cytometry analysis of the splenocytes was performed to assess leukocyte subpopulations. A. Representative FACS plots. Single live cells were gated for the CD45+ population and used for further analysis as indicated here. B. Results of FACS analysis. Percent of T cells, B cells, NK cells, dendritic cells, granulocytes, monocytes and macrophages in homozygous B-hIFNGR1/hIFNG/hIFNGR2 mice were similar to those in the C57BL/6 mice. Values are expressed as mean ± SEM.
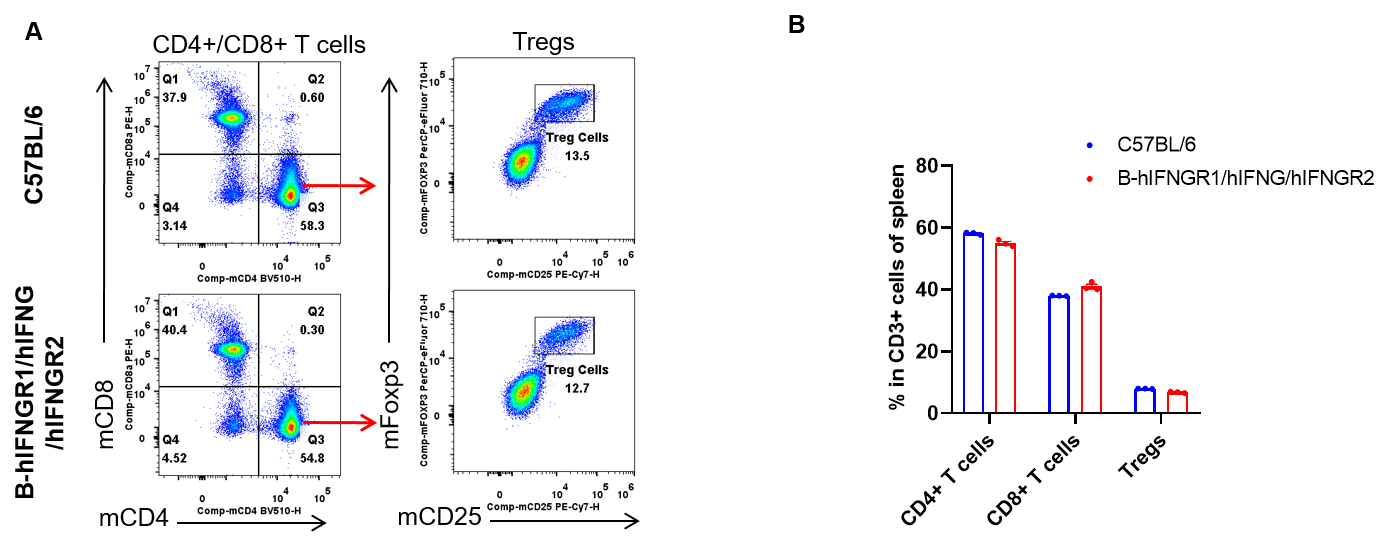
Analysis of spleen T cell subpopulations by flow cytometry. Splenocytes were isolated from female C57BL/6 and B-hIFNGR1/hIFNG/hIFNGR2 mice (n=3, 14-week-old). Flow cytometry analysis of the splenocytes was performed to assess leukocyte subpopulations. A. Representative FACS plots. Single live CD45+ cells were gated for CD3+ T cell population and used for further analysis as indicated here. B. Results of FACS analysis. The percent of CD8+ T cells, CD4+ T cells, and Tregs in homozygous B-hIFNGR1/hIFNG/hIFNGR2 mice were similar to those in the C57BL/6 mice. Values are expressed as mean ± SEM.
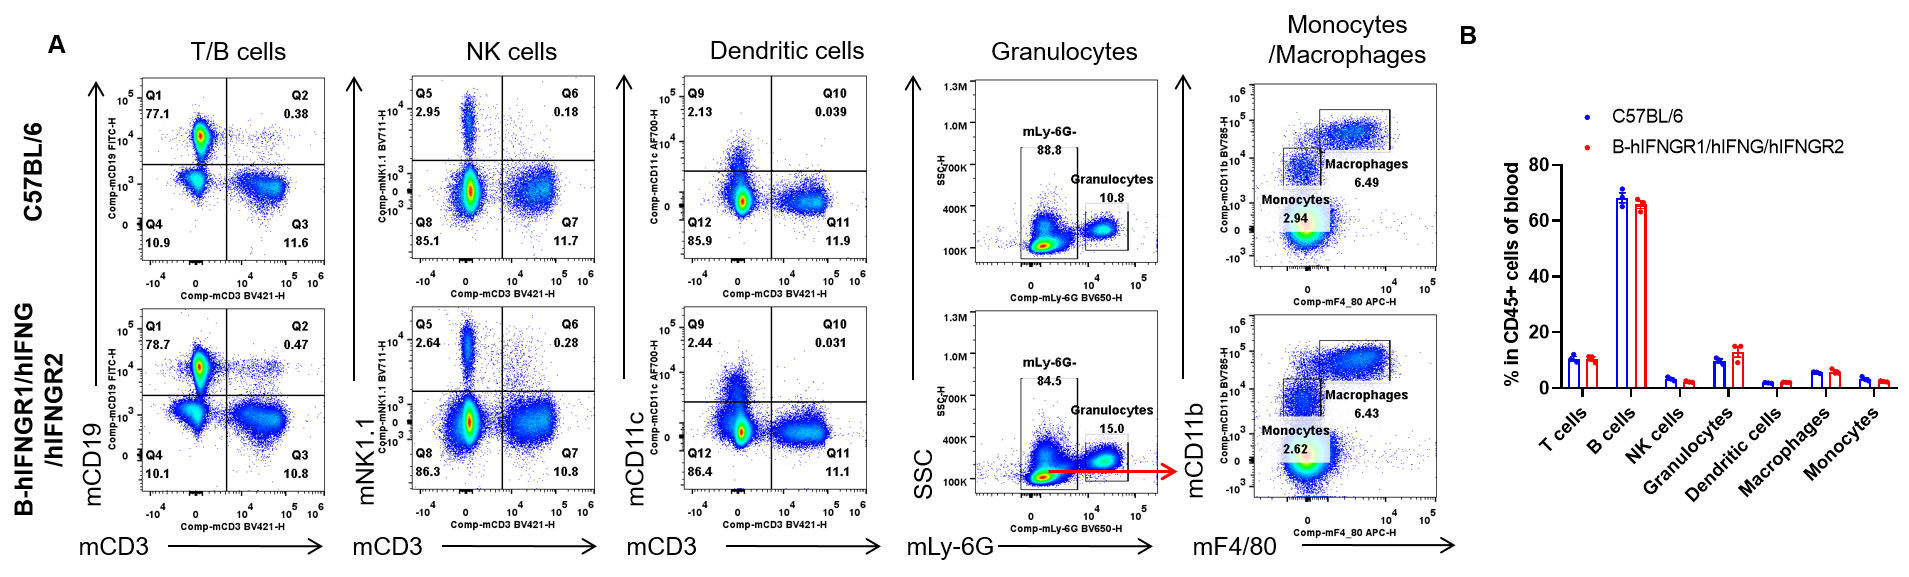
Analysis of blood leukocyte subpopulations by flow cytometry. Blood cells were isolated from female C57BL/6 and B-hIFNGR1/hIFNG/hIFNGR2 mice (n=3, 14-week-old). Flow cytometry analysis of the blood was performed to assess leukocyte subpopulations. A. Representative FACS plots. Single live cells were gated for the CD45+ population and used for further analysis as indicated here. B. Results of FACS analysis. Percent of T cells, B cells, NK cells, dendritic cells, granulocytes, monocytes and macrophages in homozygous B-hIFNGR1/hIFNG/hIFNGR2 mice were similar to those in the C57BL/6 mice. Values are expressed as mean ± SEM.
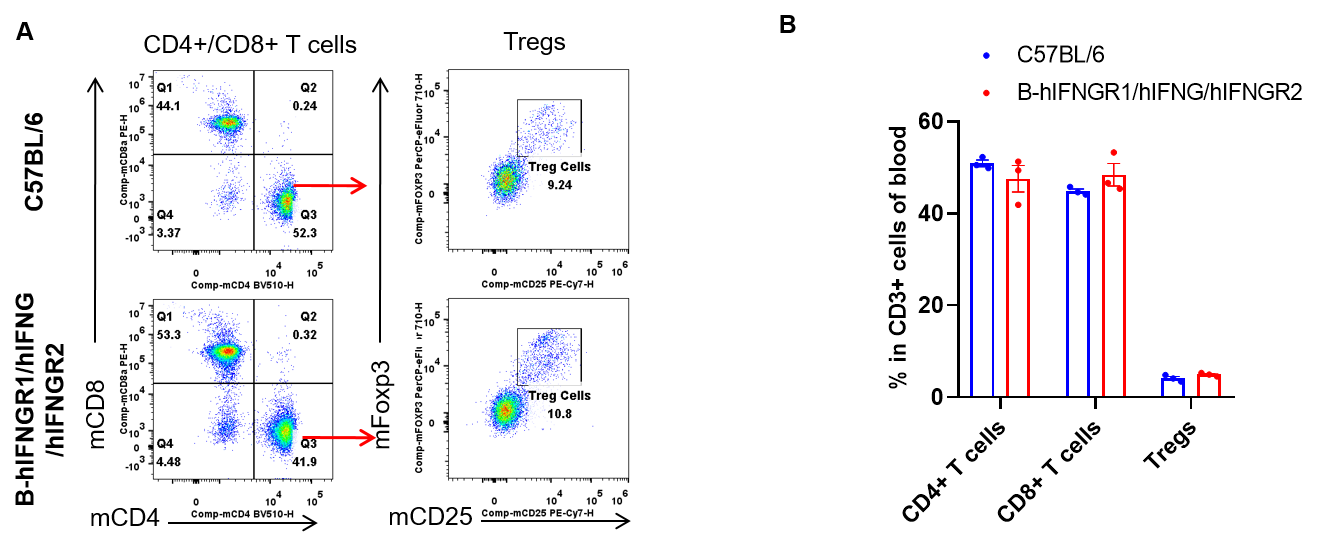
Analysis of blood T cell subpopulations by flow cytometry. Blood cells were isolated from female C57BL/6 and B-hIFNGR1/hIFNG/hIFNGR2 mice (n=3, 14-week-old). Flow cytometry analysis of the blood was performed to assess leukocyte subpopulations. A. Representative FACS plots. Single live CD45+ cells were gated for CD3+ T cell population and used for further analysis as indicated here. B. Results of FACS analysis. The percent of CD8+ T cells, CD4+ T cells, and Tregs in homozygous B-hIFNGR1/hIFNG/hIFNGR2 mice were similar to those in the C57BL/6 mice. Values are expressed as mean ± SEM.
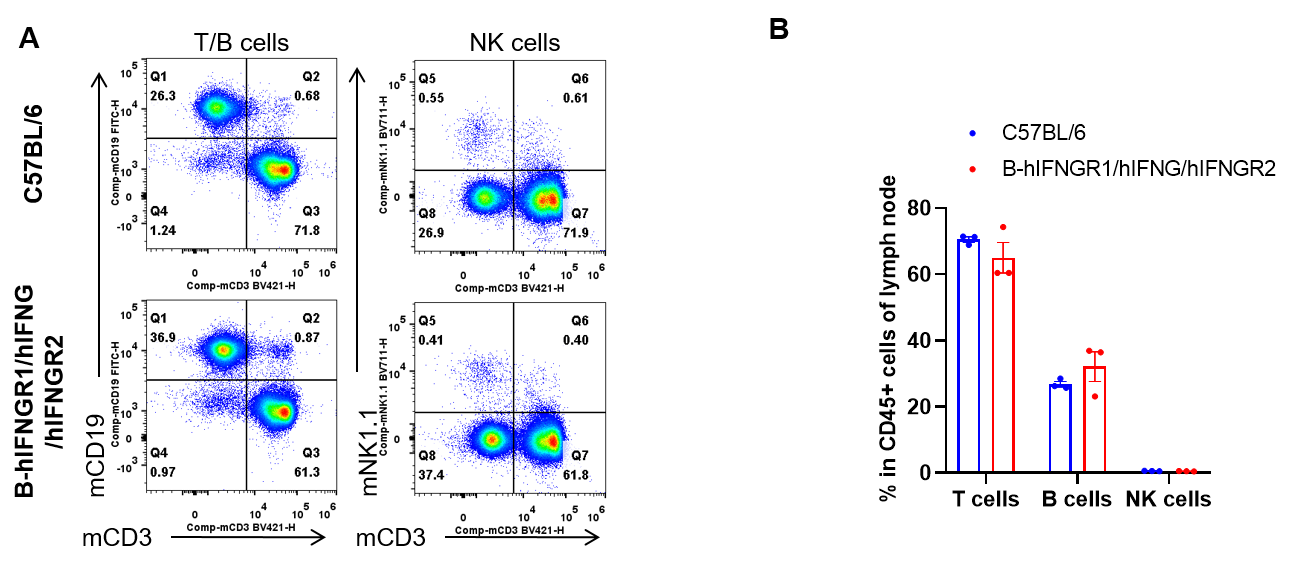
Analysis of lymph node leukocyte subpopulations by flow cytometry. Lymph node were isolated from female C57BL/6 and B-hIFNGR1/hIFNG/hIFNGR2 mice (n=3, 14-week-old). Flow cytometry analysis of the lymph node was performed to assess leukocyte subpopulations. A. Representative FACS plots. Single live cells were gated for the CD45+ population and used for further analysis as indicated here. B. Results of FACS analysis. Percent of T cells, B cells and NK cells in homozygous B-hIFNGR1/hIFNG/hIFNGR2 mice were similar to those in the C57BL/6 mice. Values are expressed as mean ± SEM.
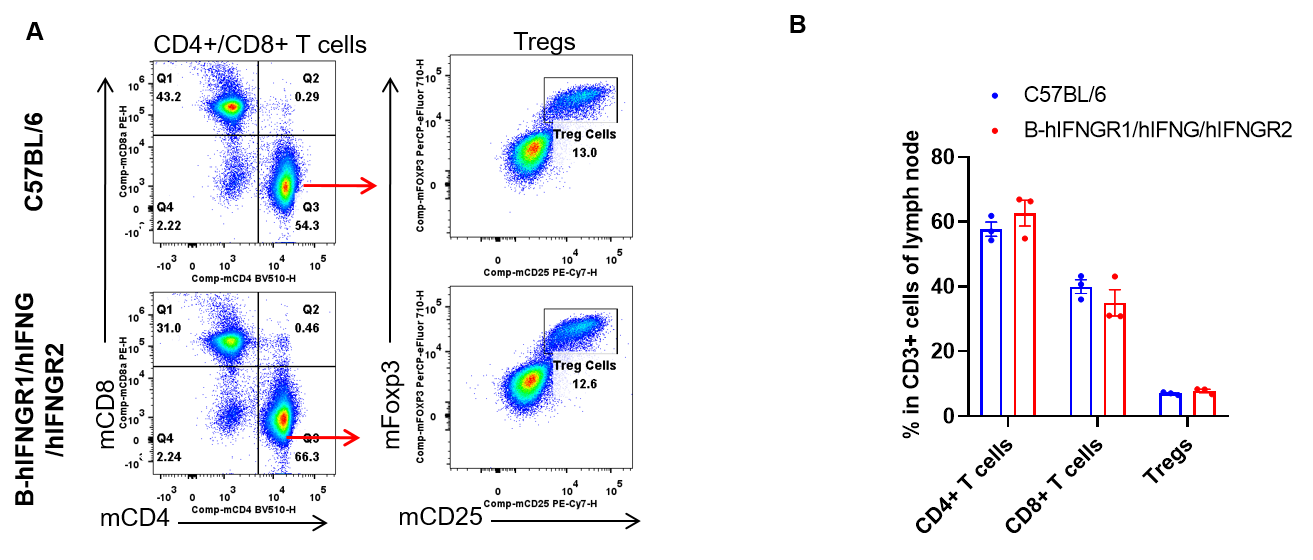
Analysis of lymph node T cell subpopulations by flow cytometry. Lymph node were isolated from female C57BL/6 and B-hIFNGR1/hIFNG/hIFNGR2 mice (n=3, 14-week-old). Flow cytometry analysis of the lymph node was performed to assess leukocyte subpopulations. A. Representative FACS plots. Single live CD45+ cells were gated for CD3+ T cell population and used for further analysis as indicated here. B. Results of FACS analysis. The percent of CD8+ T cells, CD4+ T cells, and Tregs in homozygous B-hIFNGR1/hIFNG/hIFNGR2 mice were similar to those in the C57BL/6 mice. Values are expressed as mean ± SEM.
