Biocytogen has developed various HLA-humanized models and established state-of-the-art in vivo and in vitro platforms. These models enable mouse antigen-presenting cells (APCs) to present and recognize peptide epitopes similar or identical to those in humans, accelerating the development of tumor vaccines.
on this page
The tumor antigens can be prepared as vaccine formulations by artificially synthesizing various forms of them, such as tumor cells obtained from patients, tumor-related proteins or peptides, and genes that express tumor antigens, and then combining them with adjuvants or using dendritic cells as delivery carriers. Once the vaccine enters the body, the tumor antigens are engulfed by DC cells and then processed and presented to T cells, activating the antigen-specific cytotoxic T cells to kill the tumor. The most ideal tumor-specific antigen is the neoantigen, which is generated by gene mutations in tumor cells and is not expressed in normal tissues. It can be presented on the cell surface and recognized by T cells after binding to MHC molecules.
Vaccines have evolved from purely preventive measures to therapeutic applications, with types ranging from traditional protein and peptide vaccines to advanced mRNA vaccines. Biocytogen has developed various immunogenicity evaluation and tumor efficacy models based on HLA-humanized mice and HLA-humanized tumor cell lines. These models enable mouse antigen-presenting cells (APCs) to present and recognize peptide epitopes similar or identical to those in humans, accelerating the development of tumor vaccines. We also have established state-of-the-art in vivo and in vitro platforms to comprehensively evaluate the immunogenicity, efficacy, mechanism of action, and safety of vaccines.
| Immunogenicity validation | Efficacy validation | MOA exploration |
|
|
|
Animal models for vaccines evaluation:
Syngeneic models:
Xenograft models:
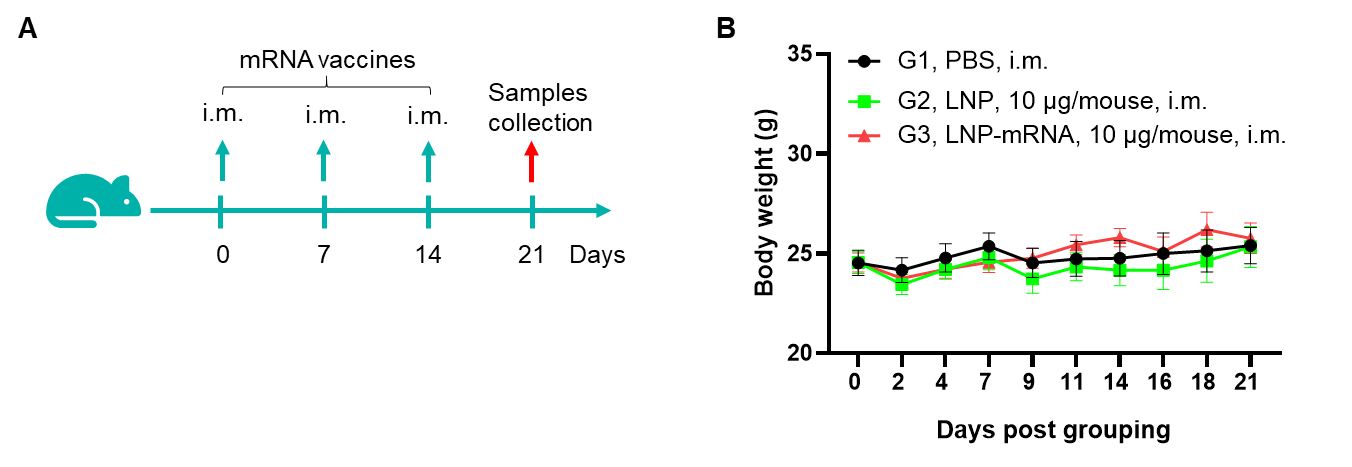
Figure 1. Detection of mRNA vaccine-induced immune responses in B-HLA-A2.1 mice. Female B-HLA-A2.1 mice at the age of 6–8 weeks were divided into PBS group and mRNA vaccine group (n = 6), and then inoculated PBS or vaccines at the inside muscle of both legs. One week after the last immunization, mice were sacrificed. The splenocytes were extracted, stimulated with individual peptide or target-unrelated polypeptide as negative control (NC), and then measured for IFN-γ secretion and antigen-specific T cells. (A) Experimental scheme. (B) No significant difference in body weight among groups. Values are expressed as mean ± SEM.
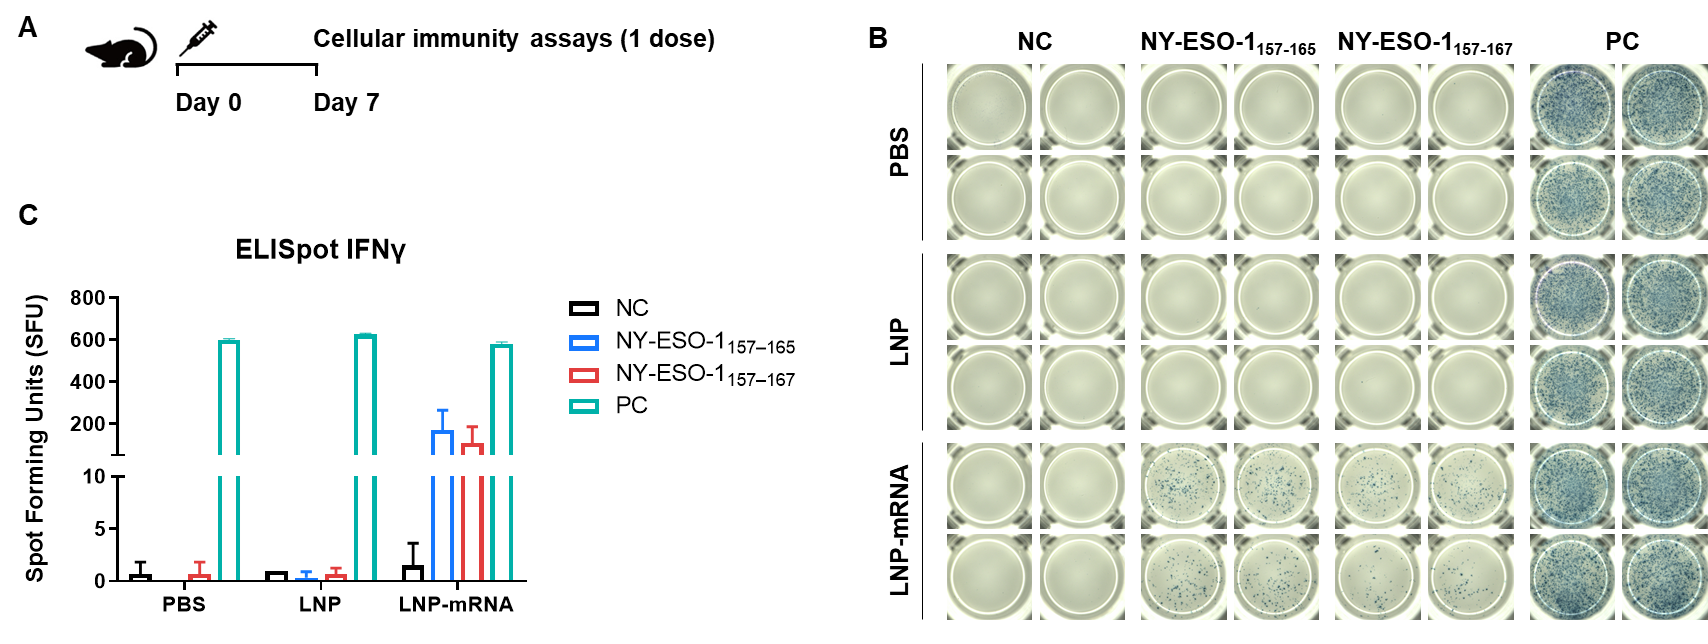
Figure 2. Detection of mRNA vaccine-induced immune responses in B-HLA-A2.1 mice by IFN-γ ELISpot assay. (A) Scheme of vaccination and testing. Male B-HLA-A2.1 mice at the age of 9–10 weeks were divided into PBS group, LNP group and LNP-mRNA group (n = 3), and then inoculated PBS, LNP or LNP-mRNA at the inside muscle of both legs. Mice were vaccinated with PBS, LNP or LNP-mRNA one time. One week after the immunization, mice were sacrificed. The splenocytes were extracted, stimulated with individual peptide, or no peptide as negative control, or PMA/Ionomycin as positive control, and then measured for IFN-γ secretion. (B) Representative results showing stimulation of splenocytes harvested from immunized mice with negative control, or peptide vaccines, or positive control in duplicates. (C) Summary of results. Values are expressed as mean ± SEM. NC: negative control. PC: positive control. (Experimental No.: 24P037503)
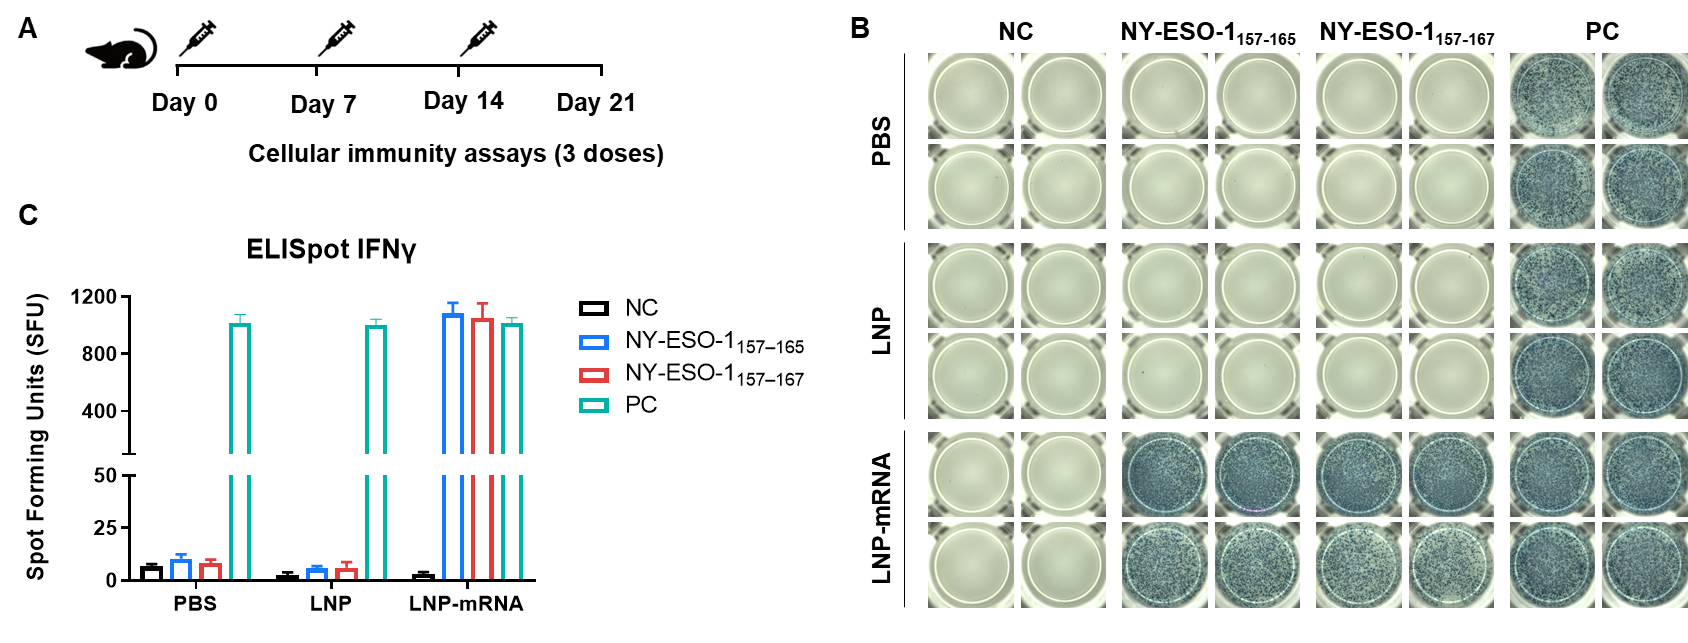
Figure 3. Detection of mRNA vaccine-induced immune responses in B-HLA-A2.1 mice by IFN-γ ELISpot assay. (A) Scheme of vaccination and testing. Male B-HLA-A2.1 mice at the age of 9–10 weeks were divided into PBS group, LNP group and LNP-mRNA group (n = 3), and then inoculated PBS, LNP or LNP-mRNA at the inside muscle of both legs. Mice were vaccinated with PBS, LNP or LNP-mRNA three times at 1-week interval. One week after the last immunization, mice were sacrificed. The splenocytes were extracted, stimulated with individual peptide, or no peptide as negative control, or PMA/Ionomycin as positive control, and then measured for IFN-γ secretion. (B) Representative results showing stimulation of splenocytes harvested from immunized mice with negative control, or peptide vaccines, or positive control in duplicates. (C) Summary of results. Values are expressed as mean ± SEM. NC: negative control. PC: positive control. (Experimental No.: 24P037503)
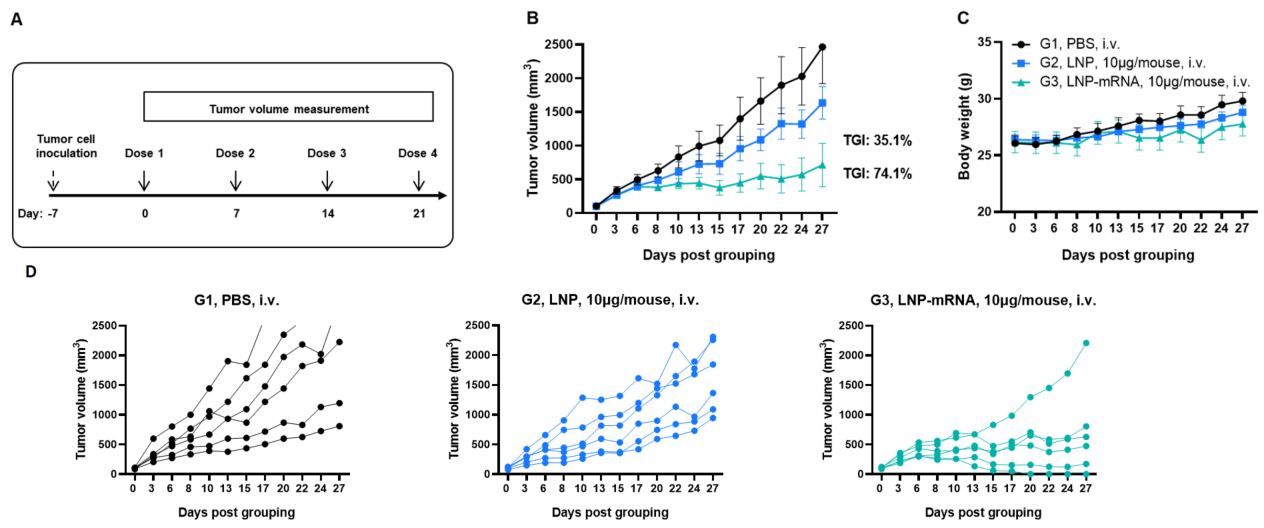
Figure 1. Antitumor activity of LNP-mRNA against syngeneic tumors. (A) Experimental scheme. (B) Antitumor activity of treatment with LNP or LNP-mRNA. B-HLA-A2.1 mice (n = 6 /group) were vaccinated with PBS, LNP or LNP-mRNA (10 μg/mouse). B-HLA-A2.1/hNY-ESO-1 MC38 cells were inoculated into the right flank of the mice. (C) Body weight changes during treatment. As shown in panel B, LNP-mRNA was efficacious in controlling tumor growth in B-HLA-A2.1 mice. (D) Antitumor activity of mRNA against syngeneic tumors. B-HLA-A2.1/hNY-ESO-1 MC38 tumor cells growth of individual mice. Values are expressed as mean ± SEM. (Experimental No.: 24P037502)
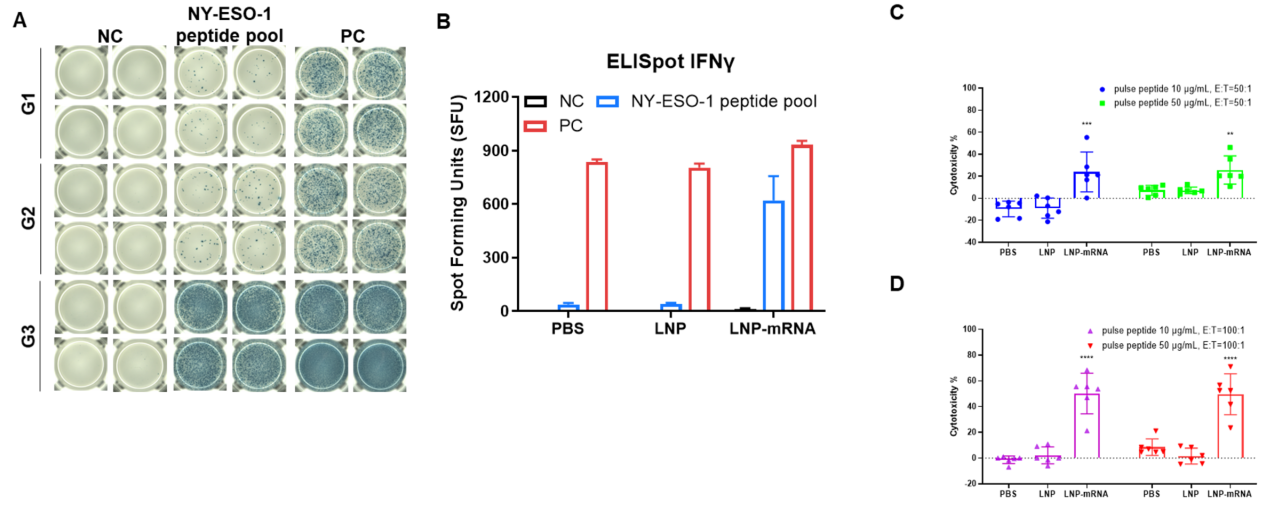
Figure 2. (A and B) Detection of vaccine-induced immune responses in B-HLA-A2.1 mice by IFN-γ ELISpot assay. NC: negative control. PC: positive control. (C and D) LDH release assay for cytotoxicity of CTLs from B-HLA-A2.1 mice immunized with PBS, LNP or LNP-mRNA against the B-HLA-A2.1/hNY-ESO-1 MC38 cell line. Cytotoxic activities of CTLs isolated from the splenocytes of immunized mice against NY-ESO-1 peptides pulsed B-HLA-A2.1/hNY-ESO-1 MC38 cell line were detected by LDH release assay at effector-to-target ratio of 50:1 or 100:1 with two different peptide concentrations, 10μg or 50μg. Values are expressed as mean ± SEM. Statistical analysis was performed using one-way ANOVA followed by Dunnett's multiple comparisons test for each treatment group compared to PBS group **p<0.01, ***p<0.001, ****p<0.0001.
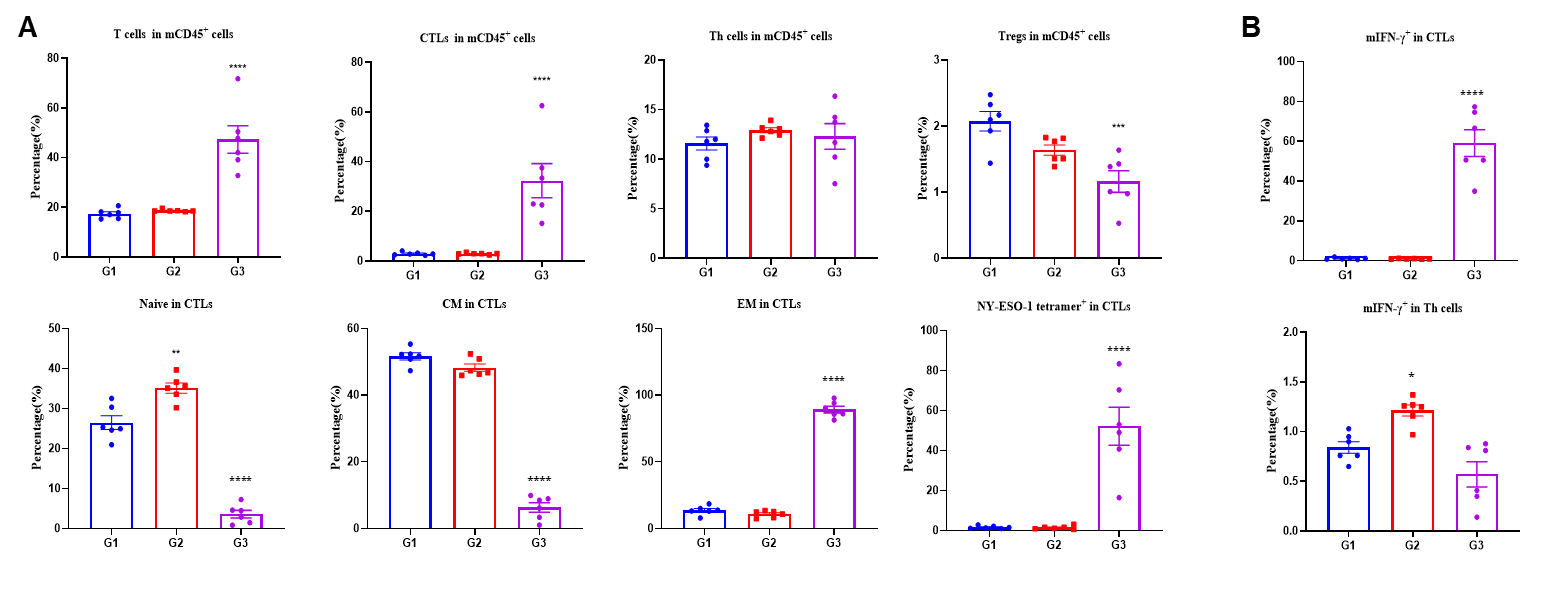
Figure 3. Vaccination mRNA vaccine generates specific effector CD8+ T cells in spleens. Spleens from B-HLA-A2.1/hNY-ESO-1 MC38 tumor-bearing mice that were immunized with the PBS, LNP, LNP-mRNA vaccines. (A) Analysis of CD8+T, CD4+ T and Tregs in the spleens determined by the flow cytometric assay. For spleen T cells and CD8+T cells, the percentage (in CD45+ cells) were significantly elevated. mRNA vaccine generated frequencies of tetramer+ CD8+ T cells at approximately 50% of total CD8+ T cells in spleens. The CD8+ T cells had an obviously lower frequency in the naïve and central memory and were mainly localized in the effector memory. (B) Intracellular cytokine staining of splenocytes isolated from immunized mice, stimulated with the NY-ESO-1 peptide. The mIFN-γ were mainly secreted by CD8+ T cells but not CD4+ T cells. Values are expressed as mean ± SEM. Statistical analysis was performed using one-way ANOVA followed by Dunnett's multiple comparisons test for each treatment group compared to G1. *p<0.05, **p<0.01, ***p<0.001, ****p<0.0001.
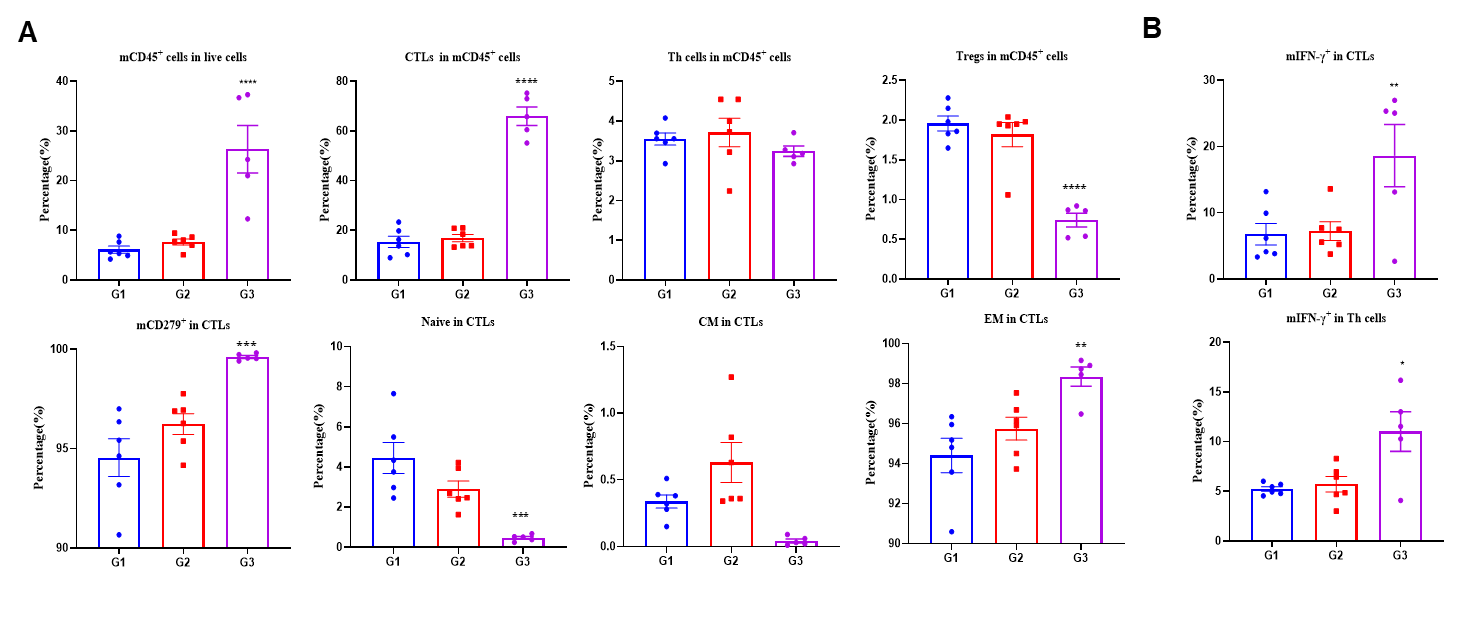
Figure 4. LNP-mRNA enhances beneficial repertoire of anti-tumor T cells. Tumors from B-HLA-A2.1/hNY-ESO-1 MC38 tumor-bearing mice that were immunized with the PBS, empty LNP or LNP-mRNA. (A) Analysis of CD8+T, CD4+ T and Tregs in the tumors determined by the flow cytometric assay. For tumor infiltrated T and CD8+T cells, the percentage (in CD45+ cells) were significantly elevated. In contrast, the frequencies of Tregs was significantly diminished in LNP-mRNA group. Tumor-infiltrated CD8+ T cells had an obviously lower frequency in the naïve and the effector memory (EM) CD8+T cells was increased significantly. (B) Intracellular cytokine staining of Tils isolated from immunized mice, stimulated with the NY-ESO-1 peptide. The mIFN-γ in Both CD8+ T cells and CD4+T cells produced mIFN-γ. Values are expressed as mean ± SEM. Statistical analysis was performed using one-way ANOVA followed by Dunnett's multiple comparisons test for each treatment group compared to G1. *p<0.05, **p<0.01, ***p<0.001, ****p<0.0001.
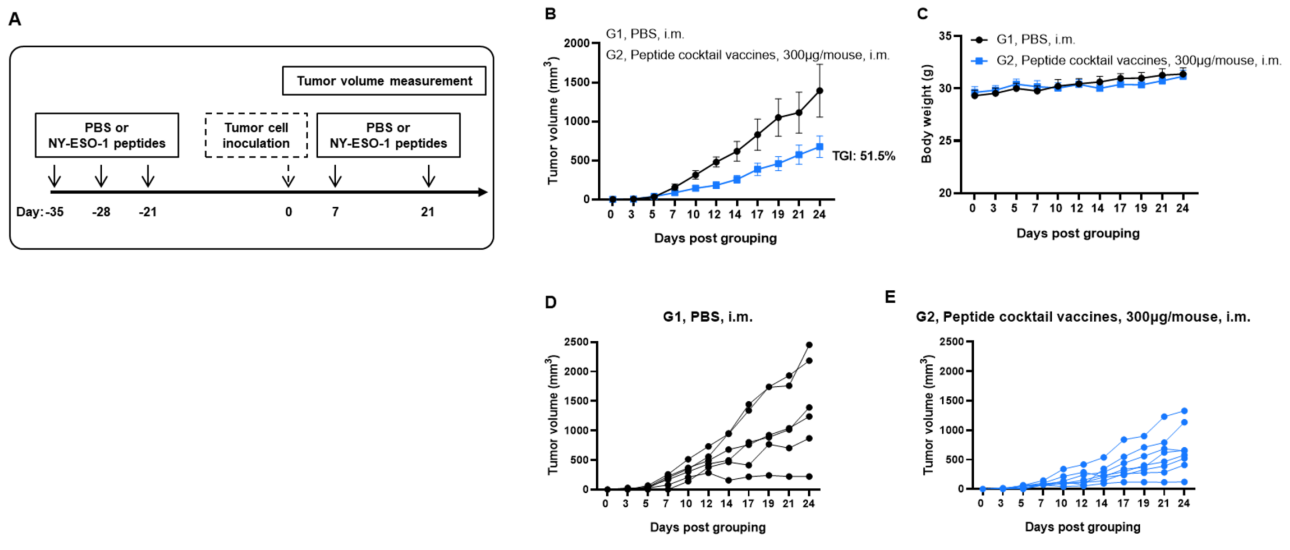
Figure 1. Antitumor activity of NY-ESO-1 peptides against syngeneic tumors. (A) Experimental scheme. (B) Antitumor activity of prophylactic treatment with NY-ESO-1 peptides. B-HLA-A2.1 mice (n = 6 or 8/group) were vaccinated with PBS or NY-ESO-1 peptides(300 µg). Three weeks after the last immunization, B-HLA-A2.1/hNY-ESO-1 MC38 cells were inoculated into the right flank of the mice. (C) Body weight changes during treatment. As shown in panel B, NY-ESO-1 peptides were efficacious in controlling tumor growth in B-HLA-A2.1 mice. (D and E) tumor growth curves from individual mice. Values are expressed as mean ± SEM.
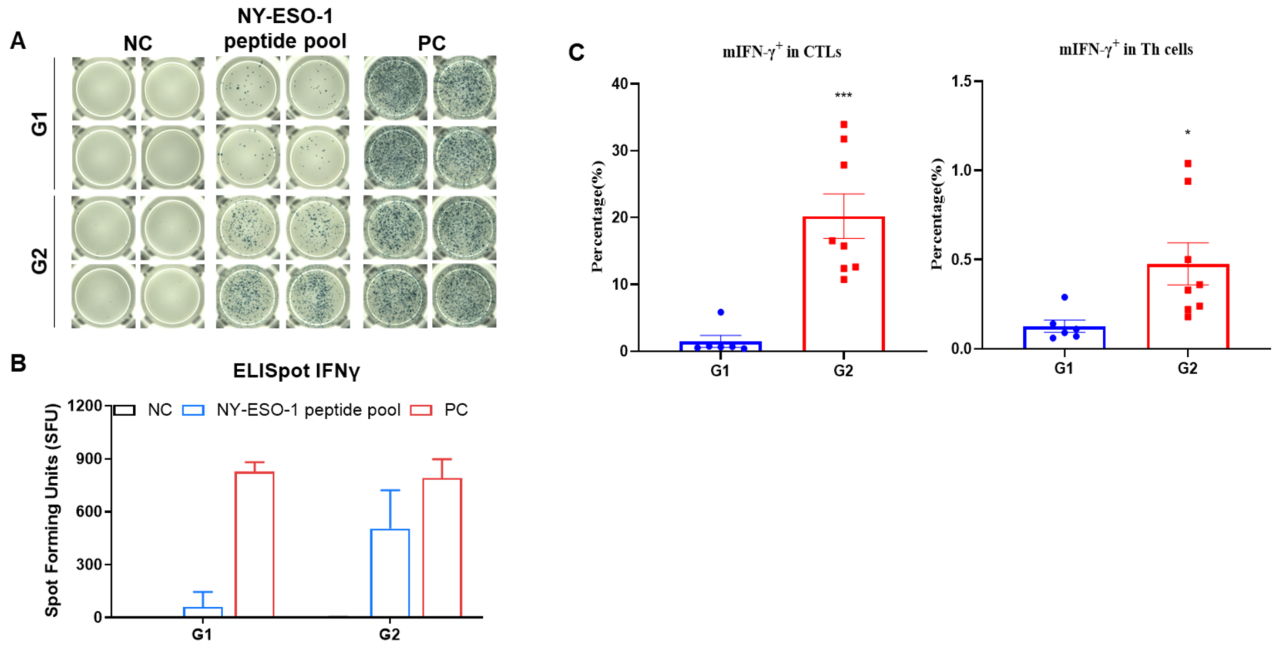
Figure 2. (A) Representative results showing stimulation of splenocytes harvested from immunized mice with negative control, or peptide vaccines in duplicates. (B) Summary of results. (C) The mIFN-γ were mainly secreted by CD8+ T cells but not CD4+ T cells. Values are expressed as mean ± SEM. Statistical significance was determined by T-test. (*p<0.05, ***p<0.001 versus G1).
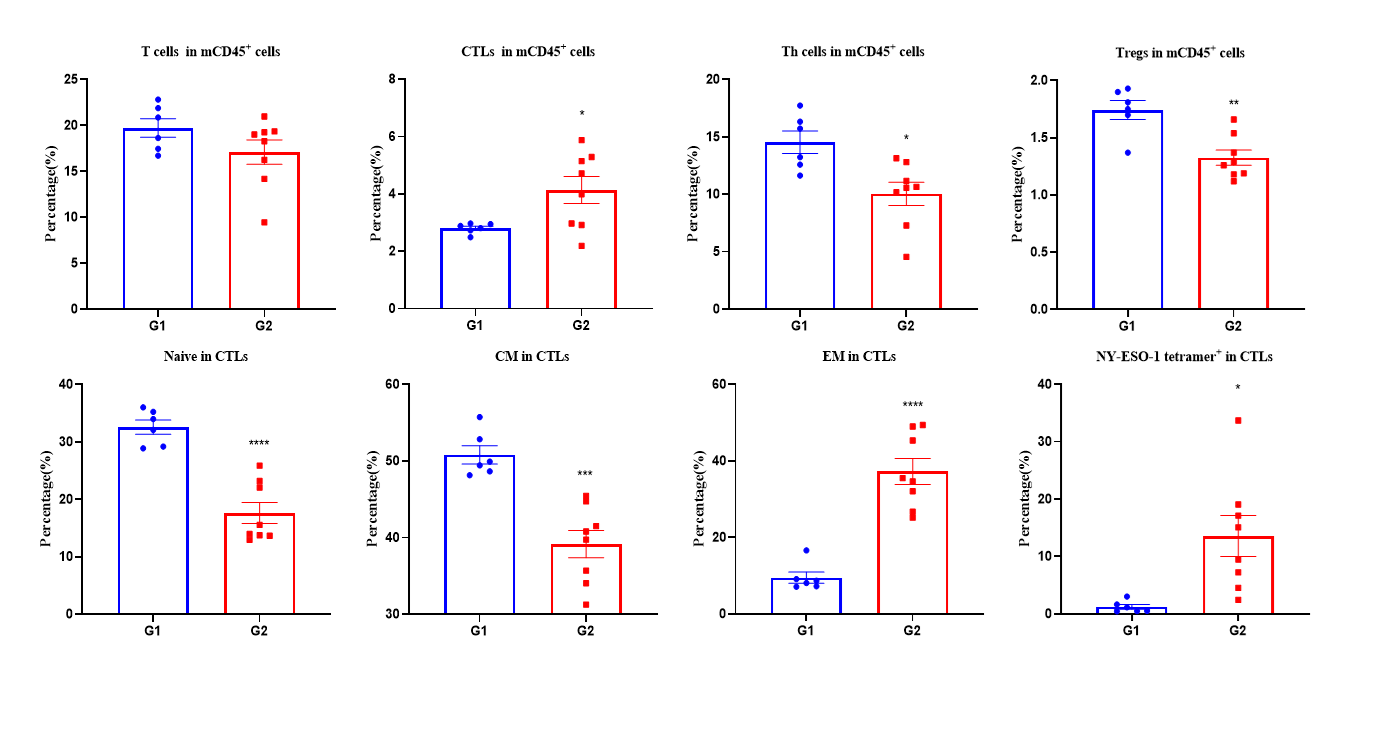
Figure 3. Vaccination peptide vaccine generates specific effector CD8+ T cells in spleens. Spleens from B-HLA-A2.1/hNY-ESO-1 MC38 tumor-bearing mice that were immunized with the PBS, Peptide cocktail vaccines. Analysis of CD8+T, CD4+ T and Tregs in the spleens determined by the flow cytometric assay. For spleen T cells and CD8+T cells, the percentage (in CD45+ cells) were significantly elevated. Peptide vaccine generated frequencies of tetramer+ CD8+ T cells at approximately 20% of total CD8+ T cells in spleens. The CD8+ T cells had an obviously lower frequency in the naïve and central memory and were mainly localized in the effector memory. Values are expressed as mean ± SEM. Statistical significance was determined by T-test. *p<0.05, **p<0.01, ***p<0.001, ****p<0.0001 versus G1.
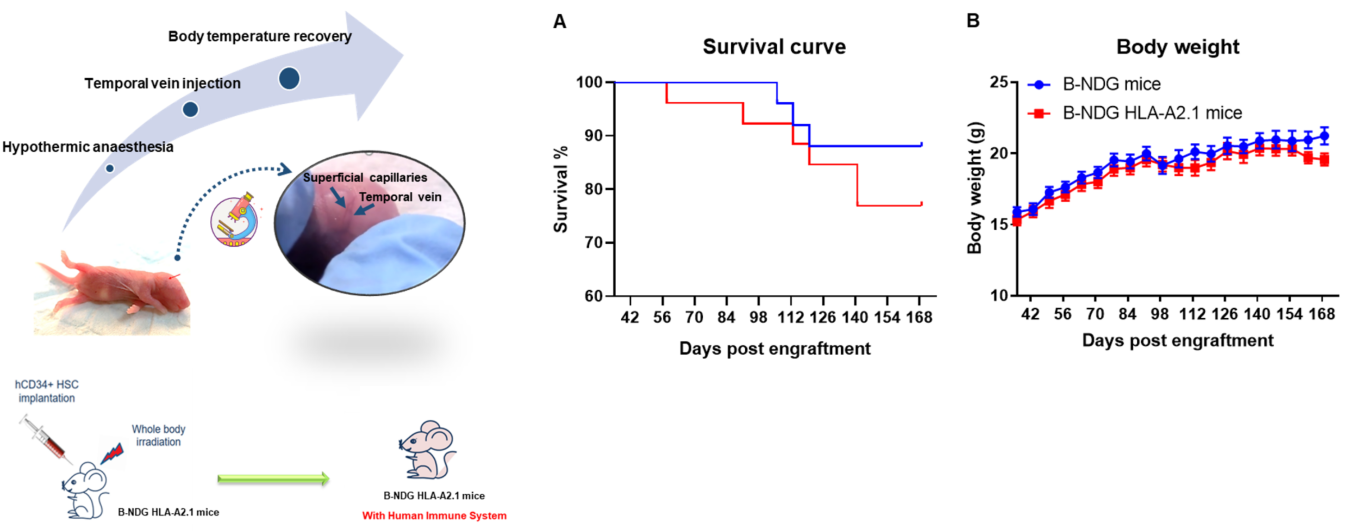
Figure 1. Human CD34+ HSCs were successfully engrafted in B-NDG HLA-A2.1 mice. Human CD34+ HSCs were respectively engrafted in new born mice of B-NDG HLA-A2.1 mice and B-NDG mice after radiated with 0.8 Gy. (A) B-NDG HLA-A2.1 mice showed slightly lower survival rate than B-NDG mice, but no statistically significant difference. (B) Body weight. Values are expressed as mean ± SEM.
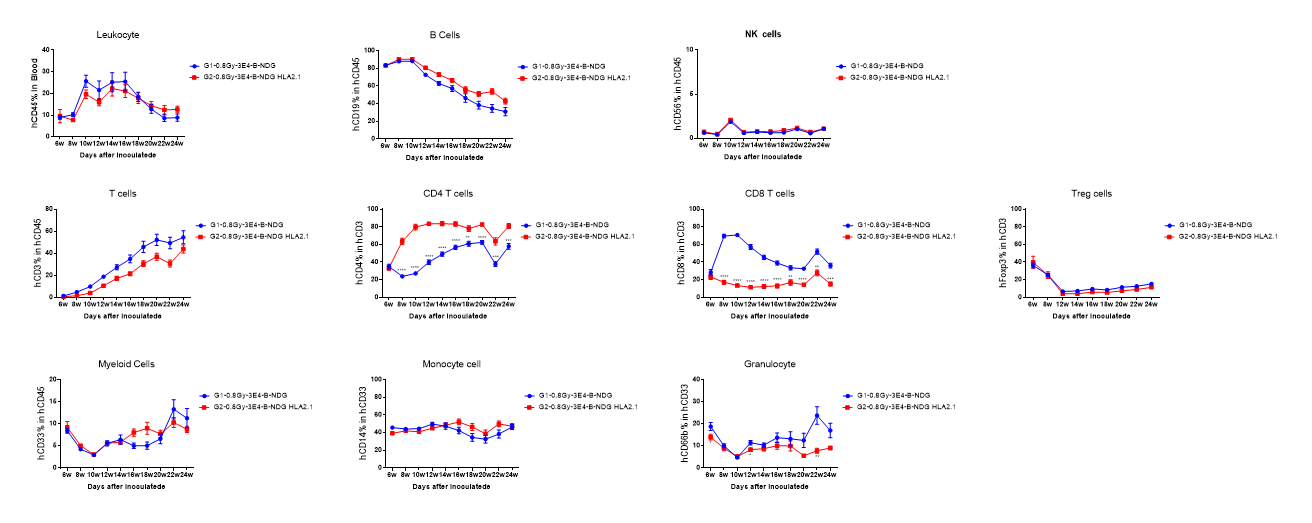
Figure 2. Human CD34+ HSCs were successfully engrafted in B-NDG HLA-A2.1 mice. Human CD34+ HSCs were respectively engrafted in new born mice of B-NDG HLA-A2.1 mice and B-NDG mice after radiated with 0.8 Gy. Human leukocytes were analyzed by flow cytometry. Results showed that although the proportion of hCD8 + T cells in B-NDG HLA-A2.1 mice was significantly lower than that in B-NDG mice, it remains sustained at around 18% within 24 weeks of reconstitution. The proportion of hCD4 + T cells in B-NDG HLA-A2.1 mice was significantly higher than that in B-NDG mice. Proportions of other reconstituted cell types in B-NDG HLA-A2.1 mice were similar to that in B-NDG mice. Values are expressed as mean ± SEM. Statistical analysis was performed using t-test for each treatment group compared to G1. *p<0.05, **p<0.01, ***p<0.001, ****p<0.0001. (Experimental No.: 21P026719).

Figure 1. Antitumor activity of peptide vaccines in xenograft tumors. (A) Experimental scheme. (B) Antitumor activity of prophylactic treatment with vaccines. HCT-8 cells were inoculated into the right flank of the B-NDG hB2M/HLA-A2.1 mice plus (HSC Reconstitution). B-NDG hB2M/HLA-A2.1 mice plus (HSC Reconstitution) (n = 8/group) were vaccinated with peptide vaccine. (C) Body weight changes during treatment. Values are expressed as mean ± SEM.
Ex vivo capability for vaccine evaluation:
IFN-γ ELISpot assay of splenocytes in response to stimulation with an mCD3e antibody
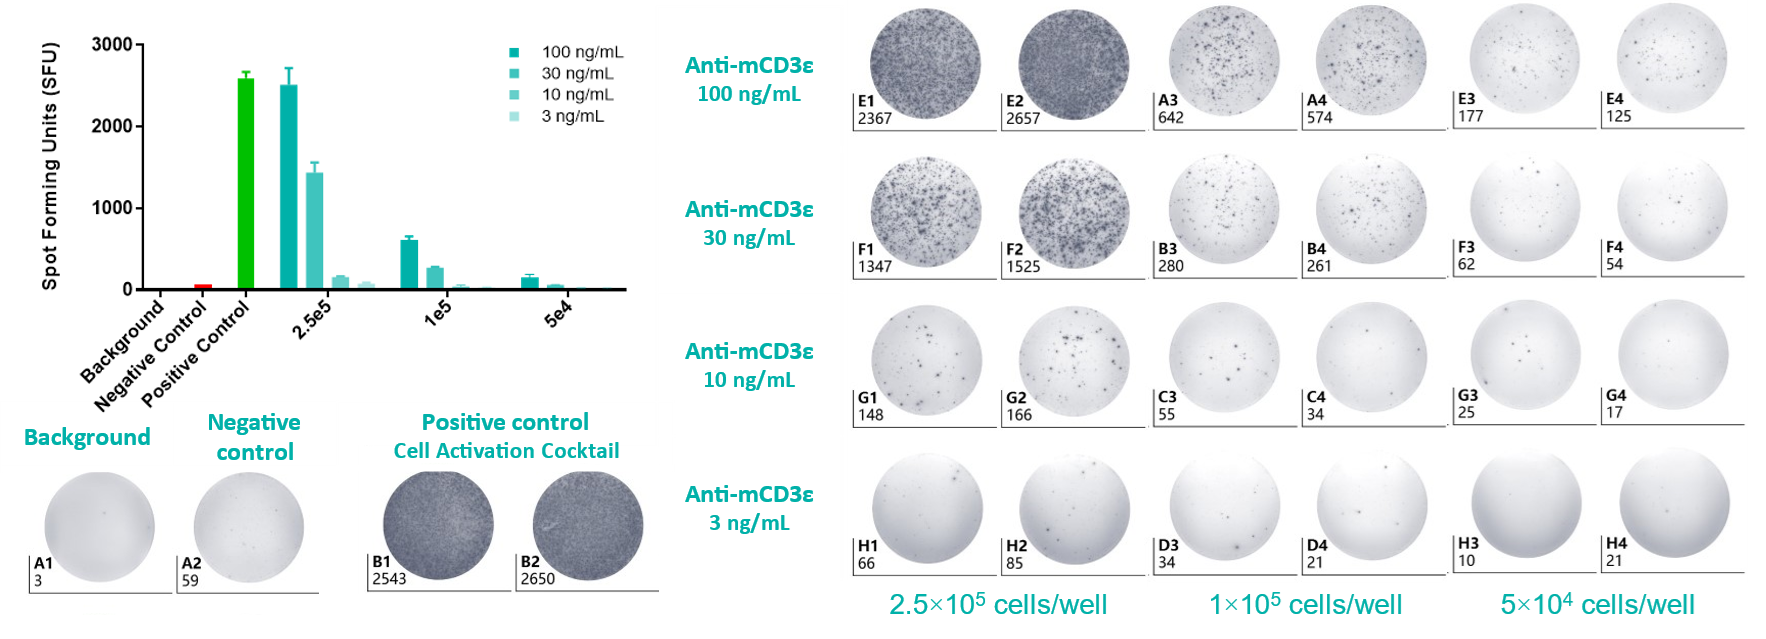
The statistical histogram and plate view of IFN-γ ELISpot assay. Splenocytes from C57BL/6 mice were seeded at density at 5.00×10⁴-2.50×10⁵/well. The number of spots indicates how much IFN-γ was produced by the splenocytes in response to stimulation with mCD3e antibody, providing information about immune cell activation levels. Values are expressed as mean ± SEM.
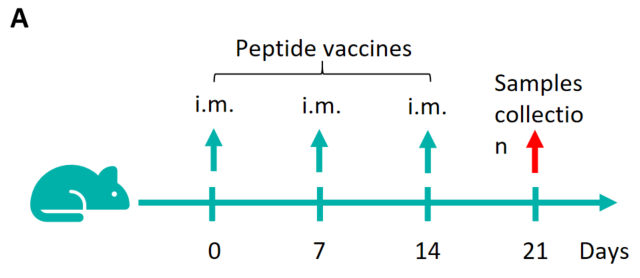
Figure 1. Detection of peptide vaccine-induced immune responses in B-HLA-A2.1 mice by mIFN-γ ELISpot assay. Female B-HLA-A2.1 mice at the age of 6–8 weeks were divided into PBS group and peptide vaccines group (n = 6), and then inoculated PBS or vaccines at the inside muscle of both legs. One week after the last immunization, mice were sacrificed. The splenocytes were extracted, stimulated with individual peptide or target-unrelated polypeptide as negative control (NC), and then measured for IFN-γ secretion and antigen-specific T cells. (A) Experimental scheme. (B) Representative results showing stimulation of splenocytes harvested from immunized mice with negative control, or peptide vaccines, or positive control in duplicates. (C) Summary of results. Values are expressed as mean ± SEM.
NC: negative control. PC: positive control
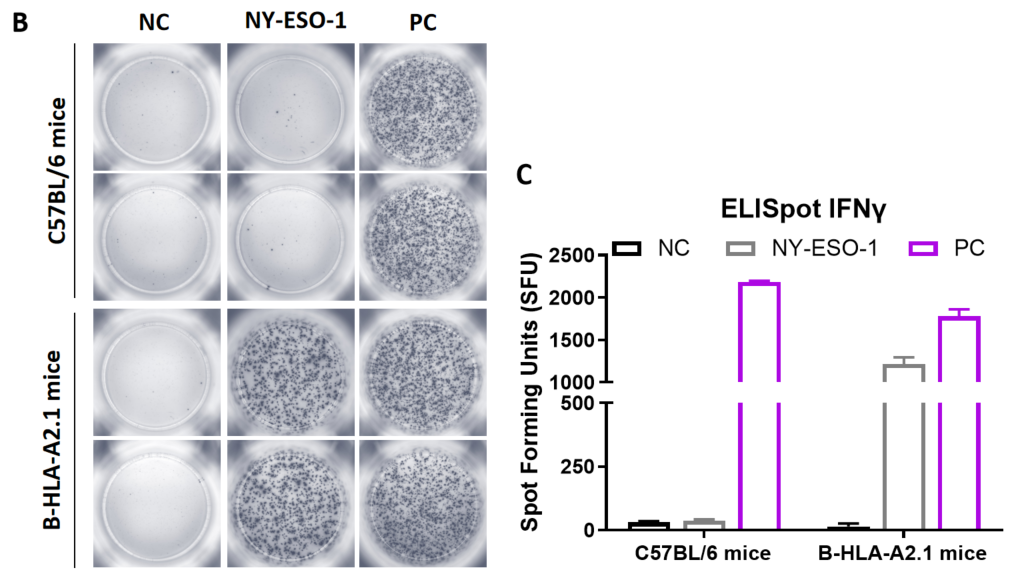
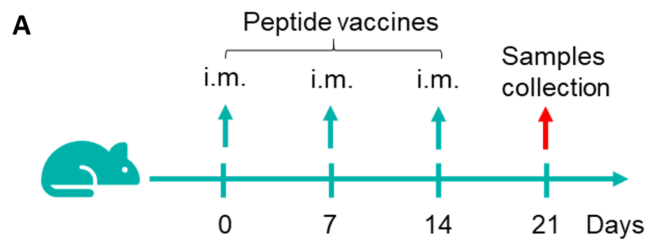
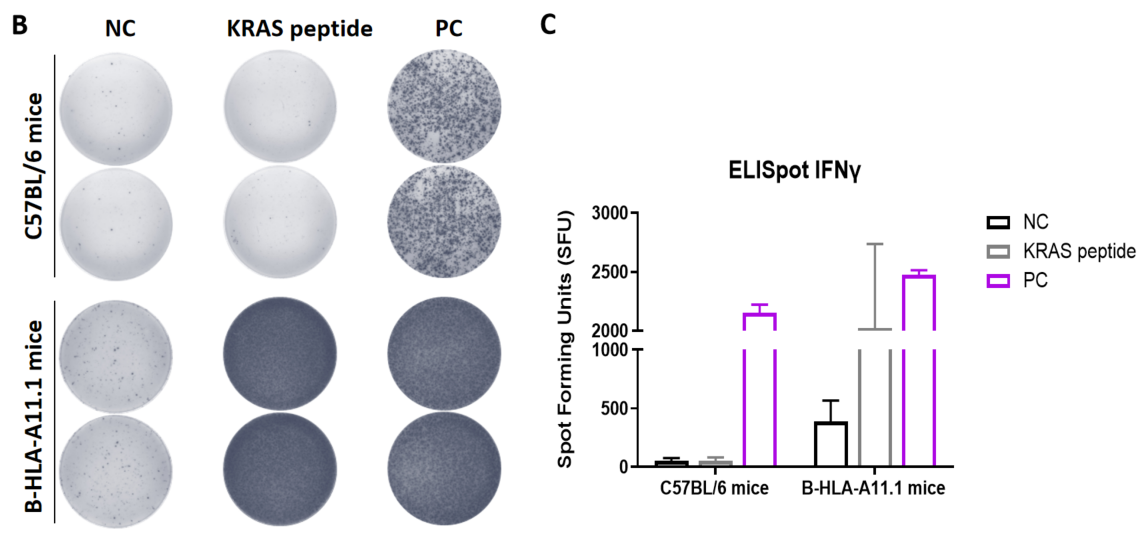
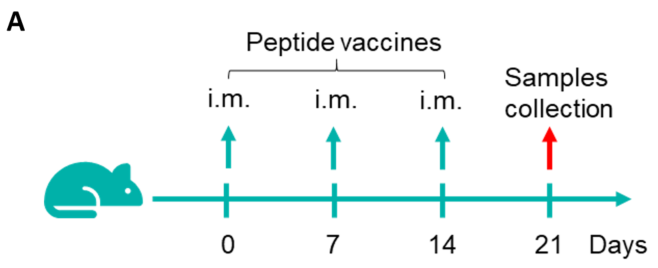
Figure 1. Detection of peptide vaccine-induced immune responses in B-HLA-A11.1 mice by mIFN-γ ELISpot assay. Female B-HLA-A11.1 mice at the age of 6–8 weeks were divided into PBS group and peptide vaccines group (n = 6), and then inoculated PBS or vaccines at the inside muscle of both legs. One week after the last immunization, mice were sacrificed. The splenocytes were extracted, stimulated with individual peptide or target-unrelated polypeptide as negative control (NC), and then measured for mIFN-γ secretion and antigen-specific T cells. (A) Experimental scheme. (B) Representative results showing stimulation of splenocytes harvested from immunized mice with negative control, or peptide vaccines, or positive control in duplicates. (C) Summary of results. Values are expressed as mean ± SEM.
NC: negative control. PC: positive control
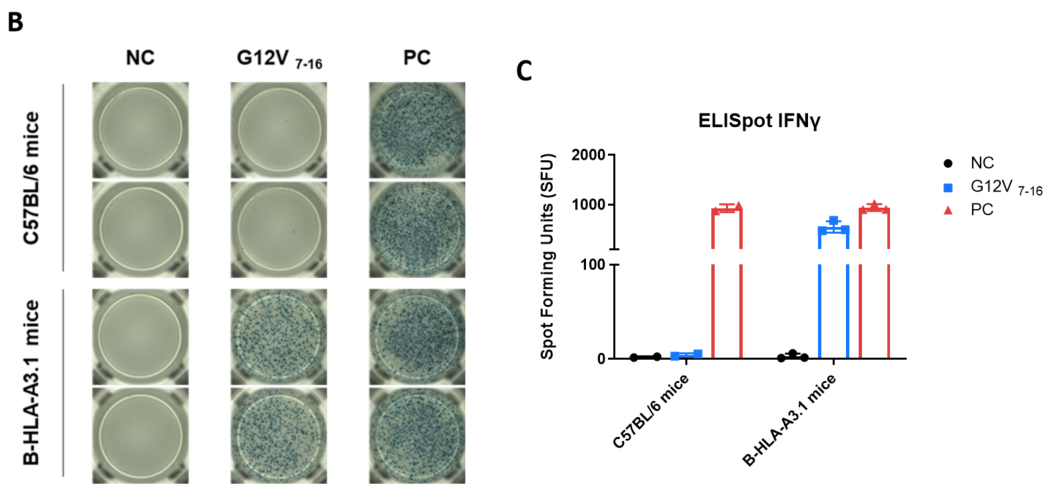
Detection of vaccine-induced immune responses in B-HLA-A3.1 mice by IFN-γ ELISpot assay. Female C57BL/6 mice and B-HLA-A3.1 mice at the age of 7–8 weeks were divided into PBS group and G12V 7-16 group (n = 3), and then inoculated PBS or vaccines at the inside muscle of both legs. The splenocytes were extracted, stimulated with individual peptide or target-unrelated polypeptide as negative control (NC) or PMA/Ionomycin(R&D, 423302) as positive control(PC), and then measured for IFN-γ secretion. (A) Representative results showing stimulation of splenocytes harvested from immunized mice with peptide vaccines in duplicates. (B) Summary of results. (C) Summary of results. Values are expressed as mean ± SEM.