

C57BL/6-Cd3etm2(CD3E)Bcgen B2mtm2(B2M/HLA-A2.1/H2-D)Bcgen/Bcgen • 111858
| Product name | B-hCD3E/HLA-A2.1 mice |
|---|---|
| Catalog number | 111858 |
| Strain name | C57BL/6-Cd3etm2(CD3E)Bcgen B2mtm2(B2M/HLA-A2.1/H2-D)Bcgen/Bcgen |
| Strain background | C57BL/6 |
| Aliases | CD3E, IMD18, T3E, TCRE,CD3e molecule; Ly-m1, Ly-m11, beta2-, beta2-m, beta2m, IMD43, HLAA |
Gene targeting strategy for B-hCD3E/HLA-A2.1 mice.
The exons 2-6 of mouse Cd3e gene that encode the extracellular domain were replaced by human CD3E exons 2-7 in B-hCD3E/HLA-A2.1 mice. The B2M gene (Exon1 to Exon3) of mouse were replaced by the sequence encompassing the human B2M CDS and HLA-A*0201 gene that included leader sequence, α1 and α2 domains ligated to a fragment of the murine H-2Db gene containing the α3, transmembrane and cytoplasmic domains.
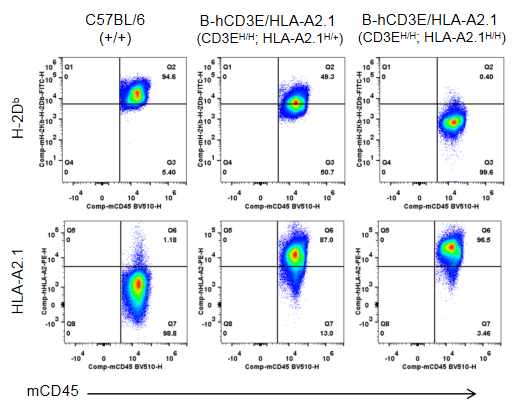
Strain specific HLA expression analysis in homozygous B-hCD3E/HLA-A2.1 mice by flow cytometry.
Splenocytes were collected from wild type (WT) mice (+/+) and B-hCD3E/HLA-A2.1 mice, and analyzed by flow cytometry. Mouse H-2Db was detectable in WT mice (+/+) and B-hCD3E/HLA-A2.1 mice (CD3EH/H; HLA-A2.1H/+) . Human HLA-A2.1 was exclusively detectable in B-hCD3E/HLA-A2.1 mice (CD3EH/H; HLA-A2.1H/+) and B-hCD3E/HLA-A2.1 mice (CD3EH/H; HLA-A2.1H/H) but not in WT mice (+/+).

Strain specific CD3E expression analysis in homozygous B-hCD3E/HLA-A2.1 mice by flow cytometry.
Splenocytes were collected from wild type (WT) mice (+/+) and B-hCD3E/HLA-A2.1 mice, and analyzed by flow cytometry with species-specific anti-hCD3E antibody. Mouse CD3E was detectable in WT mice (+/+). Human CD3E was exclusively detectable in B-hCD3E/HLA-A2.1 mice (CD3EH/H; HLA-A2.1H/+) and B-hCD3E/HLA-A2.1 mice (CD3EH/H; HLA-A2.1H/H) but not in WT mice (+/+).
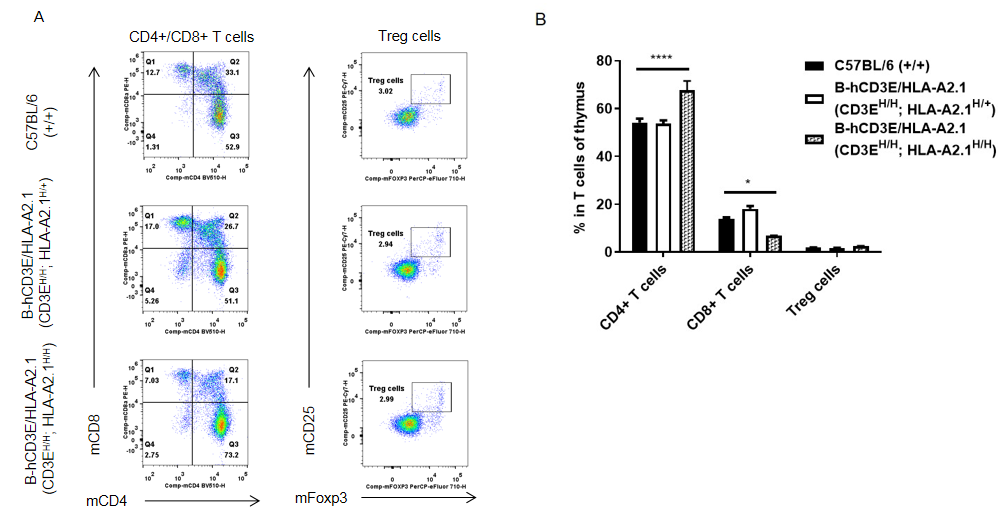
Analysis of thymus T cell subpopulations by FACS.
Thymocytes were isolated from female C57BL/6 and B-hCD3E/HLA-A2.1 mice (n=3, 8 week-old). Flow cytometry analysis of the thymocytes was performed to assess T cell subsets. A. Representative FACS plots. Single live CD45+ cells were gated for CD3 T cell population and used for further analysis as indicated. B. Results of FACS analysis. Percent of Treg cells in B-hCD3E/HLA-A2.1 mice was similar to that in the C57BL/6 mice. Compared with C57BL/6 mice, the proportion of CD4+ T cells and CD8+ T cells changed in B-hCD3E/HLA-A2.1 mice, especially the proportion of CD8+ T cells in B-hCD3E/HLA-A2.1 mice (CD3EH/H; HLA-A2.1H/H) decreased significantly. No significant decrease in the proportion of CD8+ T cells was previously observed in B-hCD3E mice, so we speculated that the introduction of hB2M-HLA-A2.1-H-2D instead of mouse counterparts may affect the development of CD8+T cells, which in turn affected the proportion of T cells in thymus. Values are expressed as mean ± SEM.
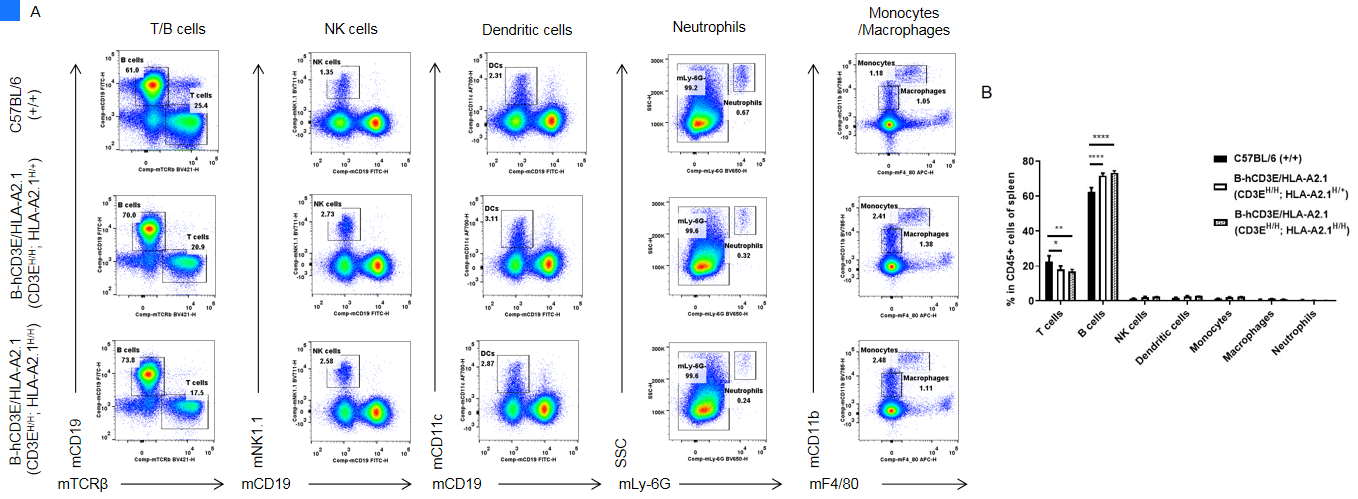
Analysis of spleen leukocyte subpopulations by FACS.
Splenocytes were isolated from female C57BL/6 and B-hCD3E/HLA-A2.1 mice (n=3, 8 week-old). Flow cytometry analysis of the splenocytes was performed to assess leukocyte subpopulations. A. Representative FACS plots. Single live cells were gated for CD45 population and used for further analysis as indicated. B. Results of FACS analysis. Percent of NK cells, dendritic cells, neutrophils, monocytes and macrophages in B-hCD3E/HLA-A2.1 mice were similar to those in the C57BL/6 mice. Compared with C57BL/6 mice, the proportion of CD4+ T cells and CD8+ T cells changed in B-hCD3E/HLA-A2.1 mice, especially the proportion of CD8+ T cells in B-hCD3E/HLA-A2.1 mice (CD3EH/H; HLA-A2.1H/H) decreased significantly. No significant decrease in the proportion of CD8+ T cells was previously observed in B-hCD3E mice, so we speculated that the introduction of hB2M-HLA-A2.1-H-2D instead of mouse counterparts may affect the development of CD8+T cells, which in turn affected the proportion of T cells in spleen. Values are expressed as mean ± SEM.
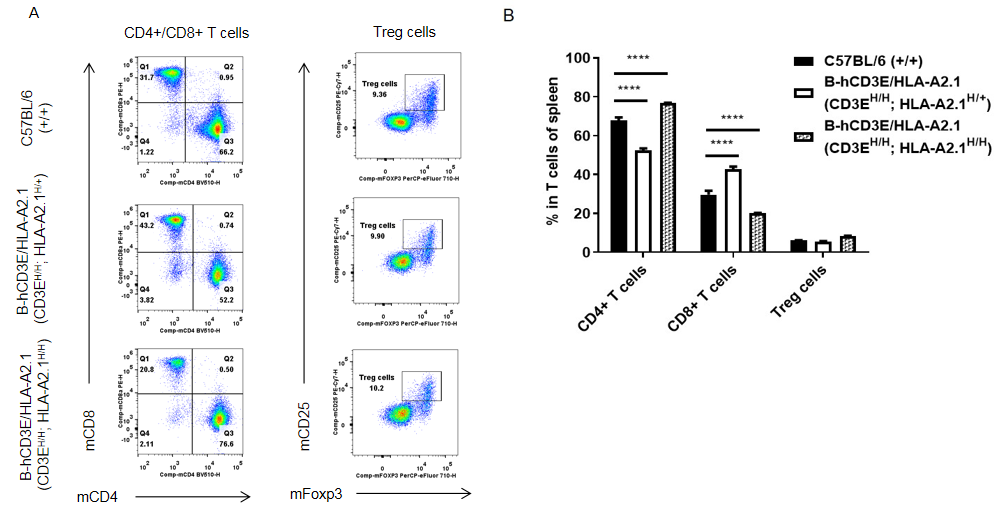
Analysis of spleen T cell subpopulations by FACS.
Splenocytes were isolated from female C57BL/6 and B-hCD3E/HLA-A2.1 mice (n=3, 8 week-old). Flow cytometry analysis of the splenocytes was performed to assess T cell subsets. A. Representative FACS plots. Single live CD45+ cells were gated for CD3 T cell population and used for further analysis as indicated. B. Results of FACS analysis. Percent of Treg cells in B-hCD3E/HLA-A2.1 mice was similar to that in the C57BL/6 mice. Compared with C57BL/6 mice, the proportion of CD4+ T cells and CD8+ T cells changed in B-hCD3E/HLA-A2.1 mice, especially the proportion of CD8+ T cells in B-hCD3E/HLA-A2.1 mice (CD3EH/H; HLA-A2.1H/H) decreased significantly. No significant decrease in the proportion of CD8+ T cells was previously observed in B-hCD3E mice, so we speculated that the introduction of hB2M-HLA-A2.1-H-2D instead of mouse counterparts may affect the development of CD8+T cells, which in turn affected the proportion of T cells in spleen. Values are expressed as mean ± SEM.
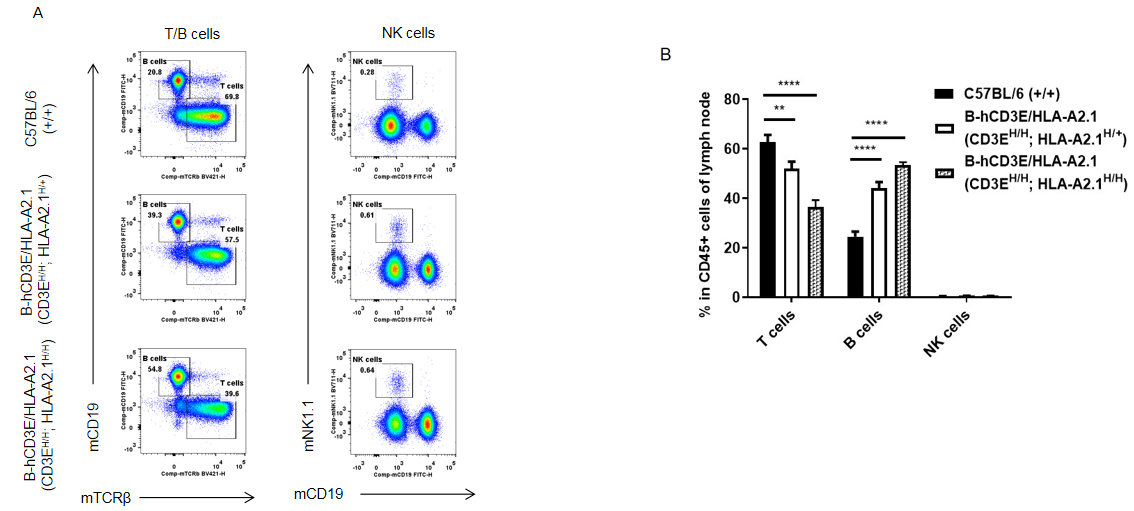
Analysis of lymph node leukocyte subpopulations by FACS.
Leukocytes were isolated from female C57BL/6 and B-hCD3E/HLA-A2.1 mice (n=3, 8 week-old). Flow cytometry analysis of the leukocytes was performed to assess leukocyte subpopulations. A. Representative FACS plots. Single live cells were gated for CD45 population and used for further analysis as indicated. B. Results of FACS analysis. Percent of NK cells in B-hCD3E/HLA-A2.1 mice was similar to those in the C57BL/6 mice. Compared with C57BL/6 mice, the proportion of CD4+ T cells and CD8+ T cells changed in B-hCD3E/HLA-A2.1 mice, especially the proportion of CD8+ T cells in B-hCD3E/HLA-A2.1 mice (CD3EH/H; HLA-A2.1H/H) decreased significantly. No significant decrease in the proportion of CD8+ T cells was previously observed in B-hCD3E mice, so we speculated that the introduction of hB2M-HLA-A2.1-H-2D instead of mouse counterparts may affect the development of CD8+T cells, which in turn affected the proportion of T cells in lymph node. Values are expressed as mean ± SEM.
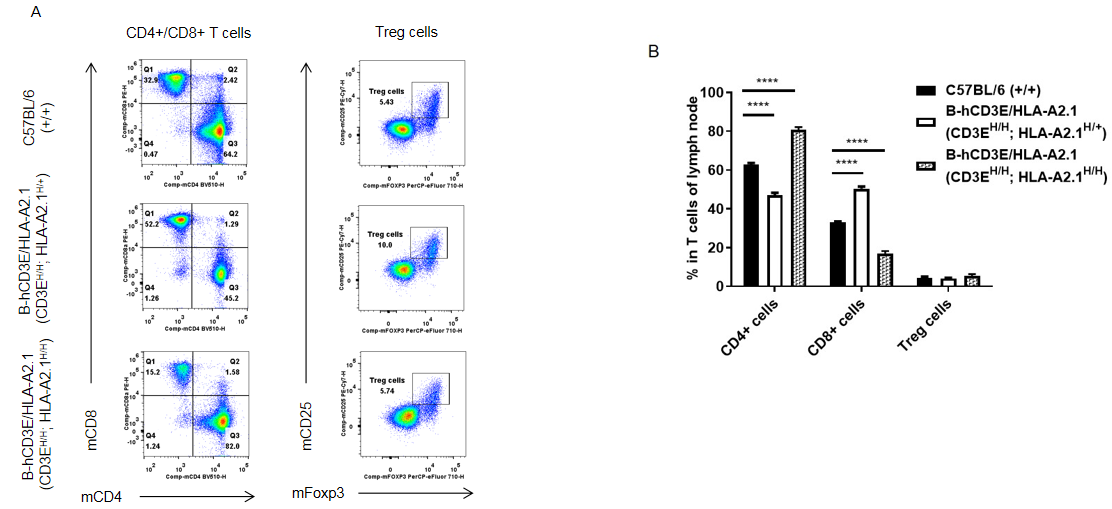
Analysis of lymph node T cell subpopulations by FACS.
Leukocytes were isolated from female C57BL/6 and B-hCD3E/HLA-A2.1 mice (n=3, 8 week-old). Flow cytometry analysis of the leukocytes was performed to assess T cell subsets. A. Representative FACS plots. Single live CD45+ cells were gated for CD3 T cell population and used for further analysis as indicated. B. Results of FACS analysis. Percent of Treg cells in B-hCD3E/HLA-A2.1 mice was similar to that in the C57BL/6 mice. Compared with C57BL/6 mice, the proportion of CD4+ T cells and CD8+ T cells changed in B-hCD3E/HLA-A2.1 mice, especially the proportion of CD8+ T cells in B-hCD3E/HLA-A2.1 mice (CD3EH/H; HLA-A2.1H/H) decreased significantly. No significant decrease in the proportion of CD8+ T cells was previously observed in B-hCD3E mice, so we speculated that the introduction of hB2M-HLA-A2.1-H-2D instead of mouse counterparts may affect the development of CD8+T cells, which in turn affected the proportion of T cells in lymph node. Values are expressed as mean ± SEM.
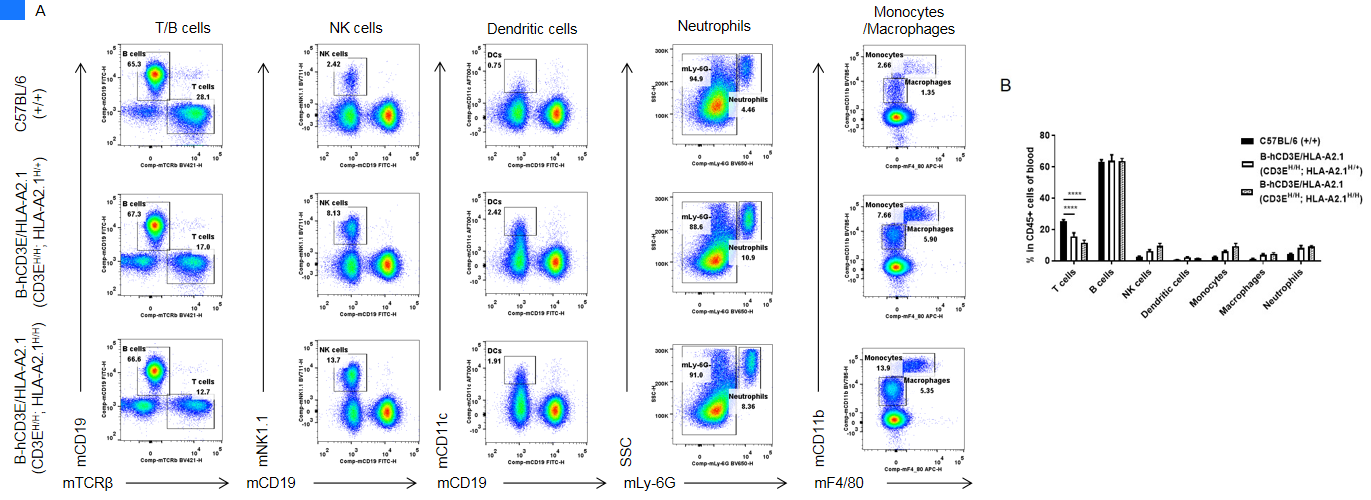
Analysis of blood leukocyte subpopulations by FACS.
Blood cells were isolated from female C57BL/6 and B-hCD3E/HLA-A2.1 mice (n=3, 8 week-old). Flow cytometry analysis of the blood leukocytes was performed to assess leukocyte subpopulations. A. Representative FACS plots. Single live cells were gated for CD45 population and used for further analysis as indicated. B. Results of FACS analysis. Percent of B cells, NK cells, dendritic cells, neutrophils, monocytes and macrophages in B-hCD3E/HLA-A2.1 mice were similar to those in the C57BL/6 mice. Compared with C57BL/6 mice, the proportion of CD4+ T cells and CD8+ T cells changed in B-hCD3E/HLA-A2.1 mice, especially the proportion of CD8+ T cells in B-hCD3E/HLA-A2.1 mice (CD3EH/H; HLA-A2.1H/H) decreased significantly. No significant decrease in the proportion of CD8+ T cells was previously observed in B-hCD3E mice, so we speculated that the introduction of hB2M-HLA-A2.1-H-2D instead of mouse counterparts may affect the development of CD8+T cells, which in turn affected the proportion of T cells in blood. Values are expressed as mean ± SEM.
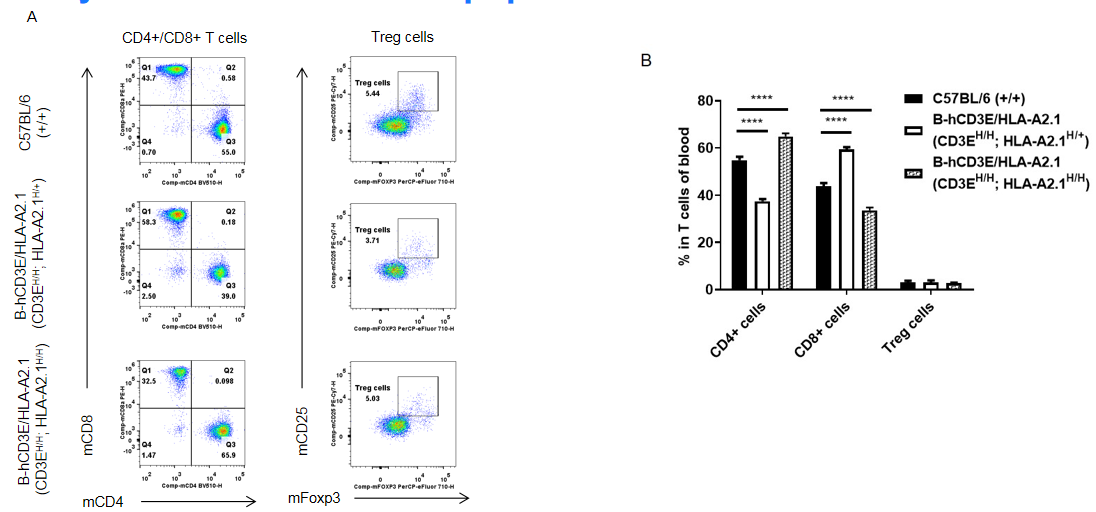
Analysis of blood T cell subpopulations by FACS.
Blood cells were isolated from female C57BL/6 and B-hCD3E/HLA-A2.1 mice (n=3, 8 week-old). Flow cytometry analysis of the leukocytes was performed to assess T cell subsets. A. Representative FACS plots. Single live CD45+ cells were gated for CD3 T cell population and used for further analysis as indicated. B. Results of FACS analysis. Percent of Treg cells in B-hCD3E/HLA-A2.1 mice was similar to that in the C57BL/6 mice. Compared with C57BL/6 mice, the proportion of CD4+ T cells and CD8+ T cells changed in B-hCD3E/HLA-A2.1 mice, especially the proportion of CD8+ T cells in B-hCD3E/HLA-A2.1 mice (CD3EH/H; HLA-A2.1H/H) decreased significantly. No significant decrease in the proportion of CD8+ T cells was previously observed in B-hCD3E mice, so we speculated that the introduction of hB2M-HLA-A2.1-H-2D instead of mouse counterparts may affect the development of CD8+T cells, which in turn affected the proportion of T cells in blood. Values are expressed as mean ± SEM.
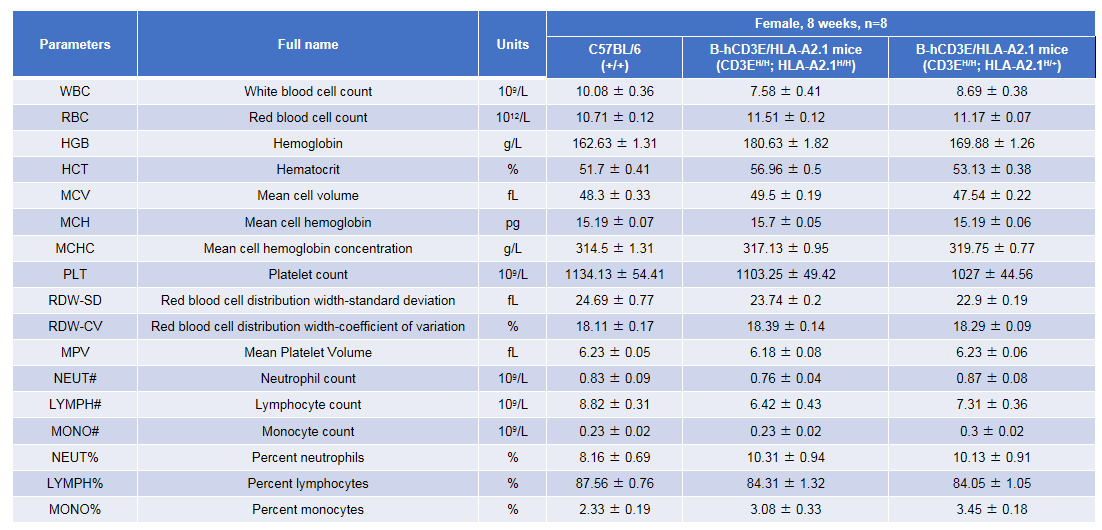
Complete blood count (CBC).
Blood from C57BL/6 and B-hCD3E/HLA-A2.1 mice (female, n=8, 8 week-old) was collected and analyzed for CBC. There was no differences among any measurement between C57BL/6 and B-hCD3E/HLA-A2.1 mice, indicating that CD3E and HLA-A2.1 humanized do not change blood cell composition and morphology. Values are expressed as mean ± SEM.
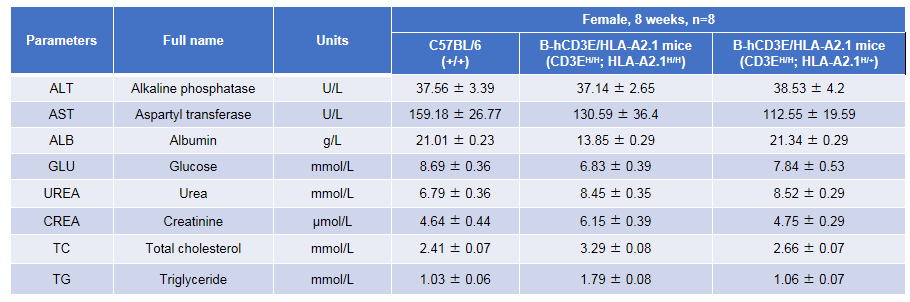
Blood biochemistry tests of B-hCD3E/HLA-A2.1 mice.
Serum from the C57BL/6 and B-hCD3E/HLA-A2.1 mice (female, n=8, 8 week-old) was collected and analyzed for levels of ALT and AST. There was no differences on either measurement between C57BL/6 and B-hCD3E/HLA-A2.1 mice, indicating that CD3E and HLA-A2.1 humanized do not change ALT and AST levels or health of liver. Values are expressed as mean ± SEM.
