B-hIL15/hIL15RA mice

C57BL/6-Il15tm1(IL15)BcgenIl15ratm1(IL15RA)Bcgen/Bcgen • 121217

B-hIL13RA2 mice
B-hIL15RA mice

B-hIL15/hIL15RA mice

Product nameB-hIL15/hIL15RA mice
Catalog number121217
Strain nameC57BL/6-Il15tm1(IL15)BcgenIl15ratm1(IL15RA)Bcgen/Bcgen
Strain backgroundC57BL/6
AliasesCD215

on this page

  • Targeting strategy
  • Phenotypic analysis
  • Efficacy
  • Related products

Posters

View All

    Publication

      Targeting strategy

      Gene targeting strategy for B-hIL15/hIL15RA mice. The mouse Il15 gene that encodes the full coding sequence was replaced by human IL15 counterpart gene sequences in B-hIL15/hIL15RA mice. The mouse Il15ra gene that encodes the extracellular region was replaced by human IL15RA counterpart gene sequences in B-hIL15/hIL15RA mice.

      mRNA expression analysis

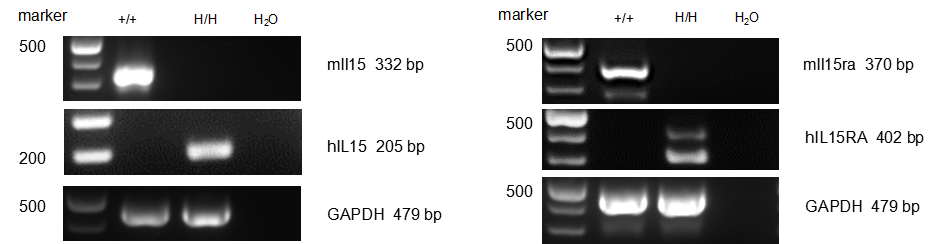
      Strain specific analysis of IL15 and IL15RA gene expression in wild-type mice and B-hIL15/hIL15RA mice by RT-PCR. Mouse Il15 and Il15ra mRNA were detectable in spleen of wild-type mice (+/+) but not in homozygous B-hIL15/hIL15RA mice (H/H). Human IL15 and IL15RA mRNA were detectable only in homozygous B-hIL15/hIL15RA mice but not in wild-type mice.

      Protein expression analysis

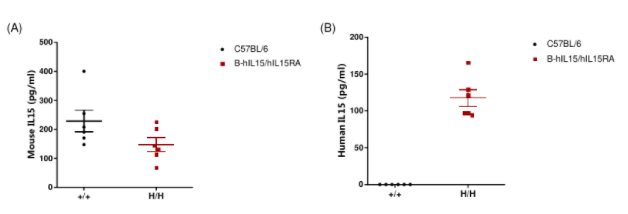
      Strain specific IL15 expression analysis in homozygous B-hIL15/hIL15RA mice by ELISA. (A) Mouse IL15; (B) Human IL15; Serum was collected from wild-type mice (+/+) and homozygous B-hIL15/hIL15RA mice (H/H), and analyzed by ELISA with IL15 ELISA kit. Human IL15 was only detectable in homozygous B-hIL15/hIL15RA mice but not in wild-type mice. Mouse IL15 was both detectable in wild-type mice and homozygous B-hIL15/hIL15RA mice. According to that mouse IL15 was not detection in homozygous B-hIL15/hIL15RA mice in mRNA level, probably the ELISA kit has cross reaction between human and mouse.

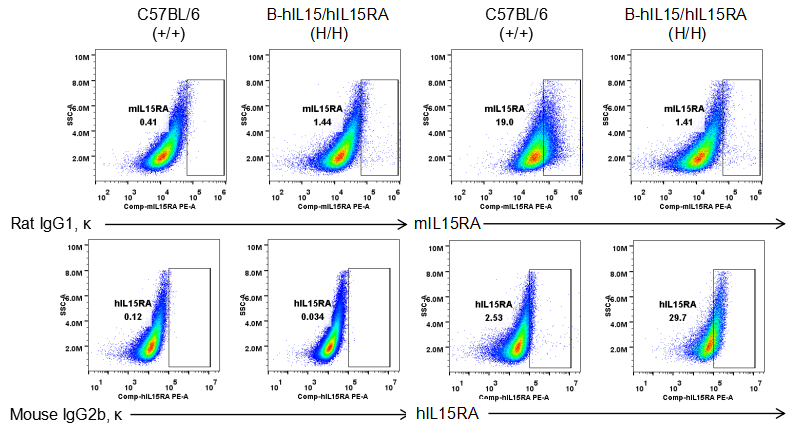
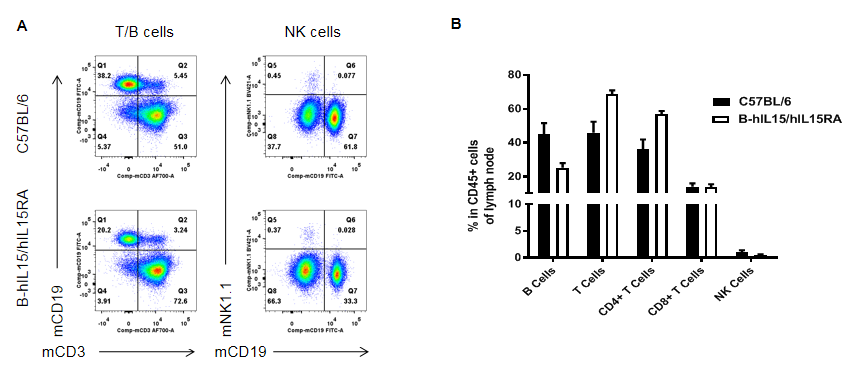
      IL15RA expression analysis in homozygous B-hIL15/hIL15RA mice by flow cytometry. Dendritic cells were collected from wild-type mice (+/+) and homozygous B-hIL15/hIL15RA mice (H/H),and analyzed by flow cytometry with species-specific anti-IL15RA antibody. Mouse IL15RA was detectable in wild-type mice but not in homozygous B-hIL15/hIL15RA mice. Human IL15RA was exclusively detectable in homozygous B-hIL15/hIL15RA mice but not in wild-type mice.

      Analysis of spleen leukocytes subpopulation
      Analysis of spleen leukocyte subpopulations by FACS. Splenocytes were isolated from female C57BL/6 and B-hIL15/hIL15RA mice (n=3, female, 8-week-old). Flow cytometry analysis of the splenocytes were performed to assess leukocyte subpopulations. A. Representative FACS plots. Single live cells were gated for the CD45+ population and used for further analysis as indicated here. B. Results of FACS analysis. Percent of T cells, B cells, NK cells, dendritic cells, granulocytes, monocytes and macrophages in homozygous B-hIL15/hIL15RA mice were similar to those in the C57BL/6 mice. Values are expressed as mean ± SEM.
      Analysis of spleen T leukocytes subpopulation
      Analysis of T cell subpopulations by FACS. Splenocytes were isolated from female C57BL/6 and B-hIL15/hIL15RA mice (n=3, female, 8-week-old). The proportion of T cells subpopulation was tested by flow cytometry. A. Representative FACS plots. Single live cells were gated for the CD3+ population and used for further analysis as indicated here. B. Results of FACS analysis. Percent of CD4+ T cells, CD8+ T cells and Tregs in homozygous B-hIL15/hIL15RA mice were similar to those in the C57BL/6 mice. Values are expressed as mean ± SEM.
      Analysis of blood leukocytes subpopulation
      Analysis of blood leukocyte subpopulations by FACS. Blood cells were isolated from female C57BL/6 and B-hIL15/hIL15RA mice (n=3, female, 8-week-old). Flow cytometry analysis of the blood cells were performed to assess leukocyte subpopulations. A. Representative FACS plots. Single live cells were gated for the CD45+ population and used for further analysis as indicated here. B. Results of FACS analysis. Percent of T cells, B cells, NK cells, dendritic cells, granulocytes, monocytes and macrophages in homozygous B-hIL15/hIL15RA mice were similar to those in the C57BL/6 mice. Values are expressed as mean ± SEM.
      Analysis of blood T leukocytes subpopulation
      Analysis of T cell subpopulations by FACS. Blood cells were isolated from female C57BL/6 and B-hIL15/hIL15RA mice (n=3, female, 8-week-old). The proportion of T cells subpopulation was tested by flow cytometry. A. Representative FACS plots. Single live cells were gated for the CD3+ population and used for further analysis as indicated here. B. Results of FACS analysis. Percent of CD4+ T cells, CD8+ T cells and Tregs in homozygous B-hIL15/hIL15RA mice were similar to those in the C57BL/6 mice. Values are expressed as mean ± SEM.
      Analysis of lymph node leukocytes subpopulation
      Analysis of lymph node leukocyte subpopulations by FACS. Lymph node cells were isolated from female C57BL/6 and B-hIL15/hIL15RA mice (n=3, female, 8-week-old). Flow cytometry analysis of the lymph node cells were performed to assess leukocyte subpopulations. A. Representative FACS plots. Single live cells were gated for the CD45+ population and used for further analysis as indicated here. B. Results of FACS analysis. Percent of T cells, B cells, NK cells, CD4+ T cells and CD8+ T cells in homozygous B-hIL15/hIL15RA mice were similar to those in the C57BL/6 mice. Values are expressed as mean ± SEM.
      Analysis of lymph node T leukocytes subpopulation
      Analysis of T cell subpopulations by FACS. Lymph node cells were isolated from female C57BL/6 and B-hIL15/hIL15RA mice (n=3, female, 8-week-old). The proportion of T cells subpopulation was tested by flow cytometry. A. Representative FACS plots. Single live cells were gated for the CD3+ population and used for further analysis as indicated here. B. Results of FACS analysis. Percent of CD4+ T cells, CD8+ T cells and Tregs in homozygous B-hIL15/hIL15RA mice were similar to those in the C57BL/6 mice. Values are expressed as mean ± SEM.
      Effects of anti-human IL15 antibody in psoriasis model of B-hIL15/hIL15RA mice

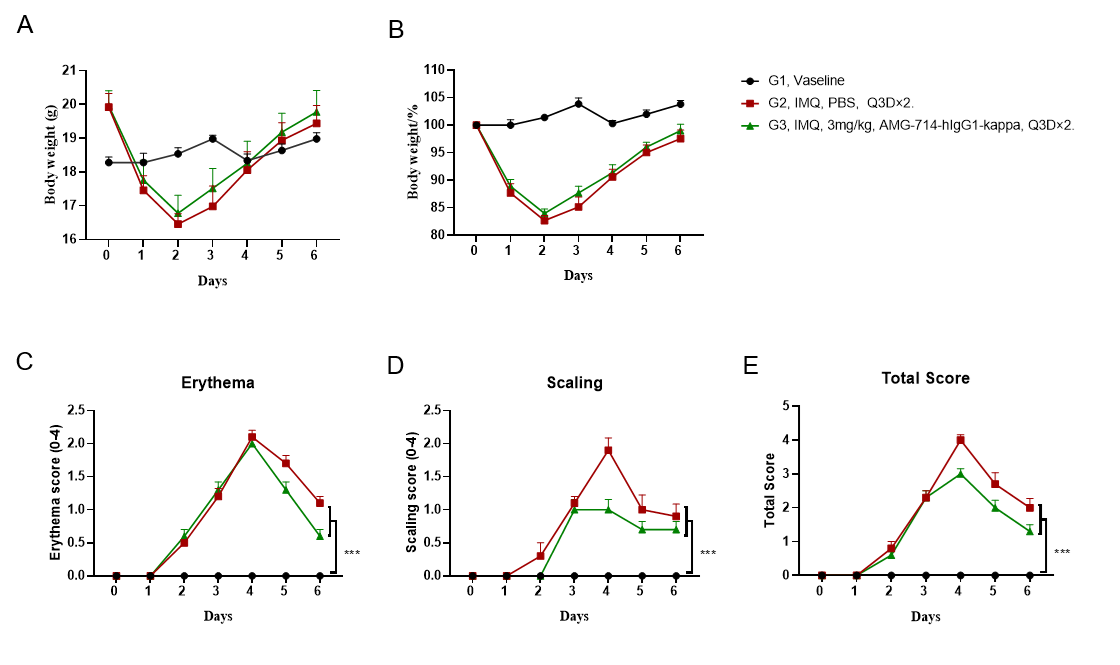
      Effects of AMG-714 (in house) in psoriasis-like skin lesions model of B-hIL15/hIL15RA mice. (A-B) Body weight changes during treatment. (C-D) Erythema and the scaling score of the back were scored daily from 0 to 6. Additionally, the total score (erythema plus scaling) is depicted (E). Results indicated that structural features of IMQ-induced skin inflammation is visible and increased in severity up to day 4. 3 mg/kg Anti-human IL15 antibody improve the disease score of erythema and scaling, but no effective in body weight.

      Target-related cell line and animal products