

C57BL/6-Tnfsf15tm2(TNFSF15)Bcgen Il23atm1(IL23A)BcgenIl12btm1(IL12B)Bcgen/Bcgen • 113038
| Product name | B-hTL1A/hIL23A/hIL12B mice |
|---|---|
| Catalog number | 113038 |
| Strain name | C57BL/6-Tnfsf15tm2(TNFSF15)Bcgen Il23atm1(IL23A)BcgenIl12btm1(IL12B)Bcgen/Bcgen |
| Strain background | C57BL/6 |
| NCBI gene ID | 9966, 51561, 3593 |
| Aliases | TL1, TL1A, TNLG1B, VEGI, VEGI192A; IL-23, IL-23A, IL23P19, P19, SGRF; CLMF, CLMF2, IL-12B, IMD28, IMD29, NKSF, NKSF2; |
| Application | This product is used for pharmacological and safety evaluation of autoimmune diseases such as Inflammatory bowel disease, psoriasis and arthritis. |
B-hTL1A/hIL23A/hIl12B mice (male, 8-week-old, n=6) were given different concentrations of DSS in drinking water for 7 days. Control mice were given water only. On day 8, mice were sacrificed and monitored for colitis. (A) Schematic diagram of DSS induced IBD model. (B) Body weights and body weight changes. (C) Clinical score. (D) Changes in the length and weight of the colon. (E) Analysis of inflammatory cell infiltration and crypt loss/ulceration in the colon. (F) Representative images of H&E stained staining of colon sections (×20). The results showed that DSS induced IBD disease model was established in B-hTL1A/hIL23A/hIL12B mice, and higher concentrations of DSS lead to more severe inflammatory bowel disease phenotypes in B-hTL1A/hIL23A/hIL12B mice. Values are expressed as mean ± SEM. Significance was determined by two-way ANOVA test or One way ANOVA. ****p
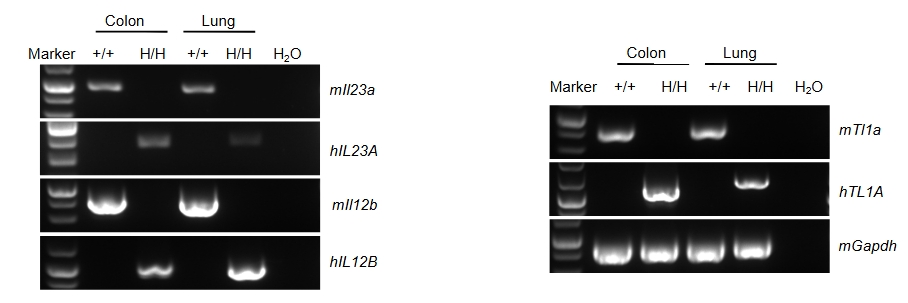
Species specific analysis of TL1A, IL23A and IL12B gene expression in wild-type C57BL/6 mice and homozygous B-hTL1A/hIL23A/hIL12B mice by RT-PCR. Colon and lung were collected from wild-type C57BL/6 mice (+/+) and homozygous B-hTL1A/hIL23A/hIL12B mice (H/H). Mouse Tl1a, Il23a and Il12b mRNA were detectable only in wild-type C57BL/6 mice. Human TL1A/hIL23A/hIL12B mRNA were detectable only in homozygous B-hTL1A/hIL23A/hIL12B mice, but not in wild-type C57BL/6 mice.
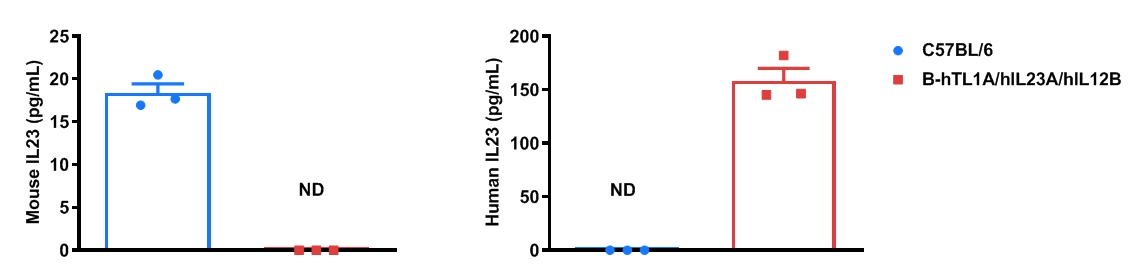
Strain specific IL23 expression analysis in wild-type C57BL/6 mice and homozygous humanized B-hTL1A/hIL23A/hIL12B mice by ELISA. Bone marrow derived dendritic cells were produced by culturing the bone marrow from wild-type C57BL/6 mice and homozygous B-hTL1A/hIL23A/hIL12B mice (female, 9-week-old, n=3), which were stimulated with LPS in vitro. After stimulation, the supernatants were collected and the levels of mouse and human IL23 were analyzed by ELISA. Mouse IL23 was only detectable in wild-type C57BL/6 mice. Human IL23 was exclusively detectable in homozygous B-hTL1A/hIL23A/hIL12B mice. Values are expressed as mean ± SEM. ND: not detectable.
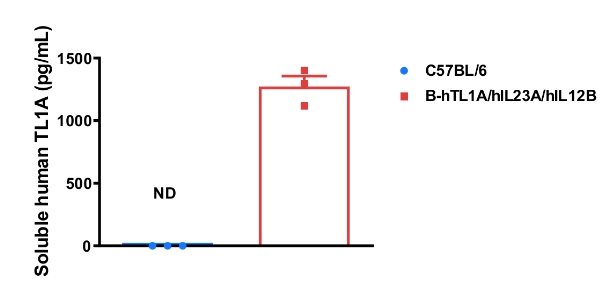
Soluble TL1A expression analysis in B-hTL1A/hIL23A/hIL12B mice by ELISA. Bone marrow derived dendritic cells were produced by culturing the bone marrow from wild-type C57BL/6 mice and homozygous B-hTL1A/hIL23A/hIL12B mice (female, 9-week-old, n=3), which were stimulated with LPS in vitro. After stimulation, the supernatants were collected and the levels of soluble TL1A was analyzed by ELISA. Soluble human TL1A was exclusively detectable in homozygous B-hTL1A/hIL23A/hIL12B mice, but not in wild-type C57BL/6 mice. Values are expressed as mean ± SEM. ND: not detectable.
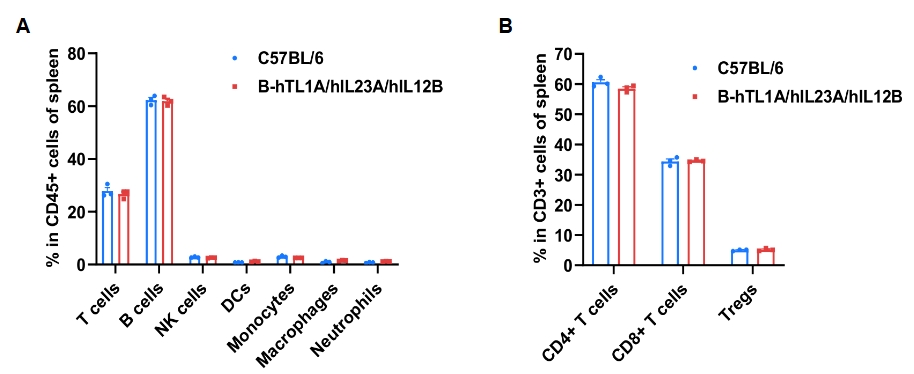
Frequency of leukocyte subpopulations in spleen by flow cytometry. Splenocytes were isolated from wild-type C57BL/6 mice and homozygous B-hTL1A/hIL23A/hIL12B mice (female, 7-week-old, n=3). A. Flow cytometry analysis of the splenocytes was performed to assess the frequency of leukocyte subpopulations. B. Frequencies of T cell subpopulations. Percentages of T cells, B cells, NK cells, DCs, monocytes, macrophages, neutrophils, CD4+ T cells, CD8+ T cells and Tregs in B-hTL1A/hIL23A/hIL12B mice were similar to those in C57BL/6 mice, demonstrating that humanization of TL1A, IL23A and IL12B do not change the frequency or distribution of these cell types in spleen. Values are expressed as mean ± SEM.
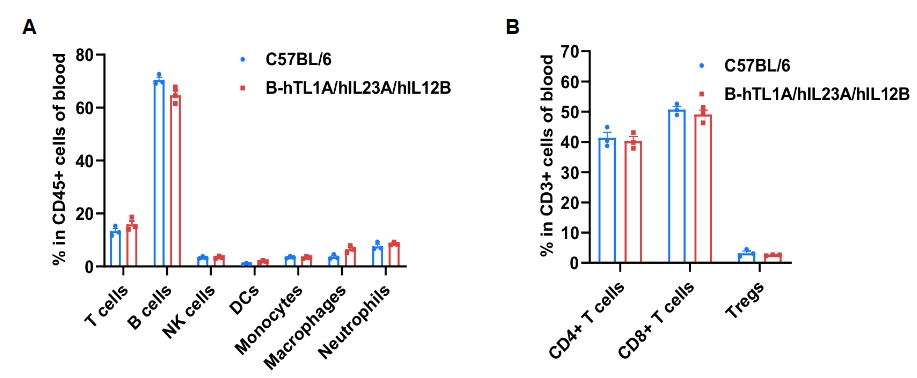
Frequency of leukocyte subpopulations in blood by flow cytometry. Blood cells were isolated from wild-type C57BL/6 mice and homozygous B-hTL1A/hIL23A/hIL12B mice (female, 7-week-old, n=3). A. Flow cytometry analysis of the blood cells was performed to assess the frequency of leukocyte subpopulations. B. Frequencies of T cell subpopulations. Percentages of T cells, B cells, NK cells, DCs, monocytes, macrophages, neutrophils, CD4+ T cells, CD8+ T cells and Tregs in B-hTL1A/hIL23A/hIL12B mice were similar to those in C57BL/6 mice, demonstrating that humanization of TL1A, IL23A and IL12B do not change the frequency or distribution of these cell types in blood. Values are expressed as mean ± SEM.
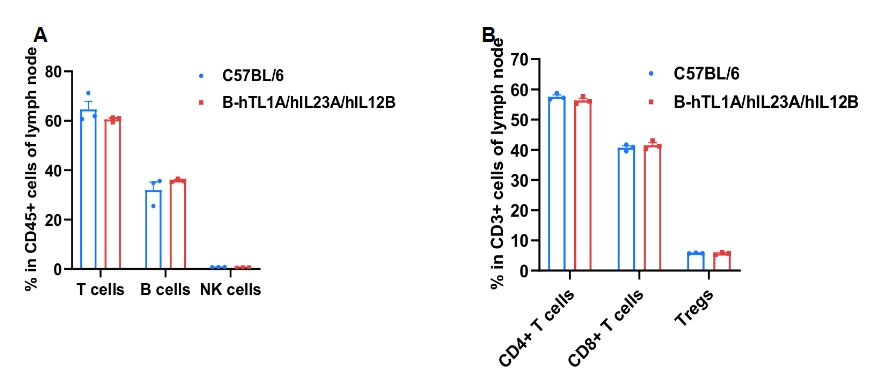
Frequency of leukocyte subpopulations in lymph node by flow cytometry. Leukocytes were isolated from wild-type C57BL/6 mice and homozygous B-hTL1A/hIL23A/hIL12B mice (female, 7-week-old, n=3). A. Flow cytometry analysis of the leukocytes was performed to assess the frequency of leukocyte subpopulations. B. Frequencies of T cell subpopulations. Percentages of T cells, B cells, NK cells, CD4+ T cells, CD8+ T cells and Tregs in B-hTL1A/hIL23A/hIL12B mice were similar to those in C57BL/6 mice, demonstrating that humanization of TL1A, IL23A and IL12B do not change the frequency or distribution of these cell types in lymph node. Values are expressed as mean ± SEM.
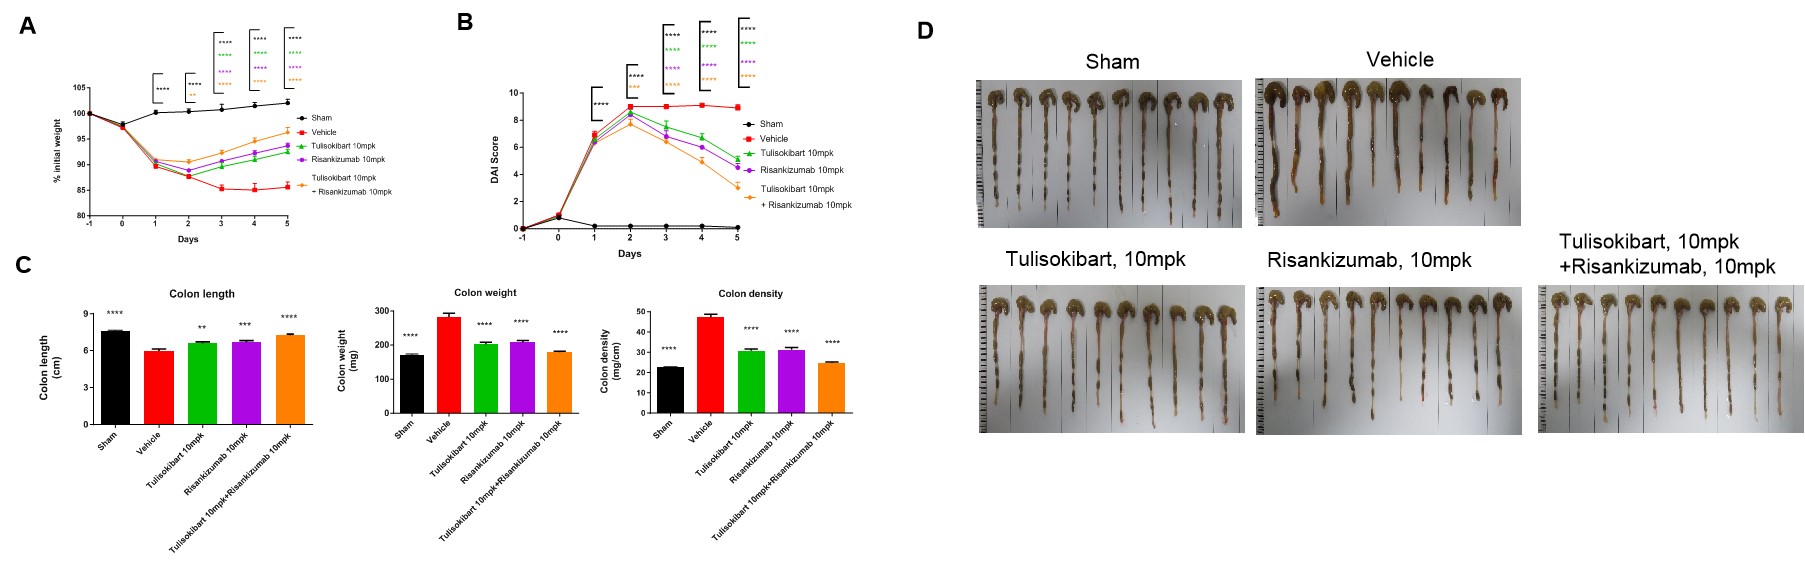
TNBS solution was instilled into the colon lumen of B-hTL1A/hIL23A/hIL12B mice (female, 8-10 weeks-old, n=10). The control group (Sham) received intrarectal injections of 50% ethanol. The treatment groups received anti-human TL1A antibody Tulisokibart (10 mpk, provided by WuXi AppTec), anti-human IL23p19 antibody Risankizumab (10 mpk, provided by WuXi AppTec) alone or in combination. Body weight and DAI score were recorded daily. On day 5, the mice were sacrificed, and colon length and weight were recorded. Colon tissue was later used for H&E staining. (A) Body weight change. (B) DAI score. (C) Colon Index. (D) Colon photo. A TNBS-induced acute colitis model was established in B-hTL1A/hIL23A/hIL12B mice. Administration of anti-human TL1A antibody Tulisokibart and anti-human IL23p19 antibody Risankizumab effectively improved TNBS-induced acute colitis, and their combination provided better efficacy. The results indicate that B-hTL1A/hIL23A/hIL12B mice are a powerful tool for evaluating in vivo efficacy of the combination of anti-human TL1A antibody and anti-human IL23p19 antibody. Values are expressed as mean ± SEM. *p<0.05, **p<0.01, ***p<0.001, ****p<0.0001, versus Vehicle, ANOVA.
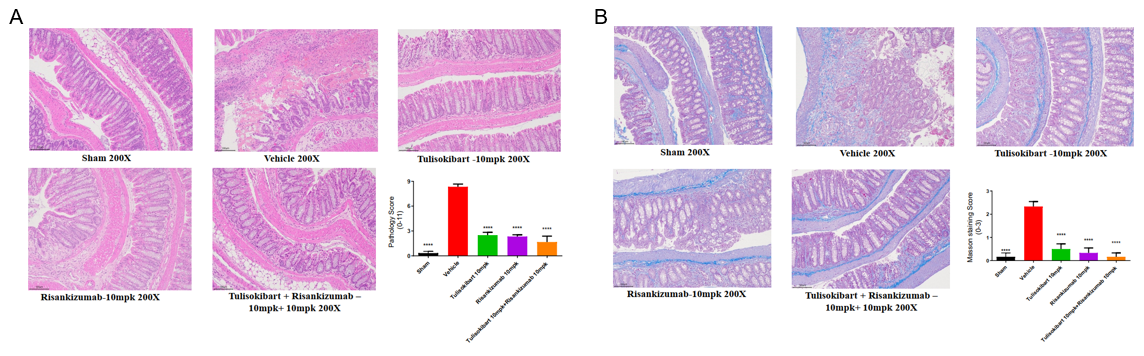
TNBS solution was instilled into the colon lumen of B-hTL1A/hIL23A/hIL12B mice (female, 8-10 weeks-old, n=10). The control group (Sham) received intrarectal injections of 50% ethanol. The treatment groups received anti-human TL1A antibody Tulisokibart (10 mpk, provided by WuXi AppTec), anti-human IL23p19 antibody Risankizumab (10 mpk, provided by WuXi AppTec) alone or in combination. On day 5, the mice were sacrificed, and the colon tissue was used for H&E staining and Masson staining. (A) Pathological score. (B) Masson staining score. A TNBS-induced acute colitis model was established in B-hTL1A/hIL23A/hIL12B mice. Administration of anti-human TL1A antibody Tulisokibart and anti-human IL23p19 antibody Risankizumab effectively ameliorated colonic pathological damage and fibrotic progression in TNBS-induced acute colitis mice, and their combination provided better efficacy. The results indicate that B-hTL1A/hIL23A/hIL12B mice are a powerful tool for evaluating in vivo efficacy of the combination of anti-human TL1A antibody and anti-human IL23p19 antibody. Values are expressed as mean ± SEM. *p<0.05, **p<0.01, ***p<0.001, ****p<0.0001, versus Vehicle, ANOVA.
Note: This experiment was conducted by WuXi AppTec using in B-hTL1A/hIL23A/hIL12B mice.
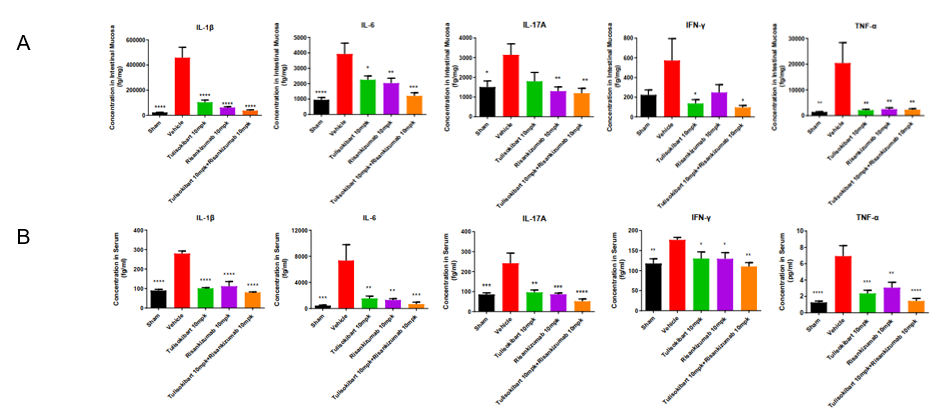
TNBS solution was instilled into the colon lumen of B-hTL1A/hIL23A/hIL12B mice (female, 8-10 weeks-old, n=10). The control group (Sham) received intrarectal injections of 50% ethanol. The treatment groups received anti-human TL1A antibody Tulisokibart (10 mpk, provided by WuXi AppTec), anti-human IL23p19 antibody Risankizumab (10 mpk, provided by WuXi AppTec) alone or in combination. On day 5, the mice were sacrificed, and the intestinal mucosa and serum were collected for cytokine analysis. (A) The concentrations of IL-1β, IL-6, IL-17A, IFN-γ, TNF-α in intestinal mucosa. (B) The concentrations of IL-1β, IL-6, IL-17A, IFN-γ, TNF-α in serum. A TNBS-induced acute colitis model was established in B-hTL1A/hIL23A/hIL12B mice. Administration of anti-human TL1A antibody Tulisokibart and anti-human IL23p19 antibody Risankizumab markedly reduced the production of inflammatory cytokines in TNBS-induced acute colitis mice, and their combination provided better efficacy. The results indicate that B-hTL1A/hIL23A/hIL12B mice are a powerful tool for evaluating in vivo efficacy of the combination of anti-human TL1A antibody and anti-human IL23p19 antibody. Values are expressed as mean ± SEM. *p<0.05, **p<0.01, ***p<0.001, ****p<0.0001, versus Vehicle, ANOVA.
Note: This experiment was conducted by WuXi AppTec using in B-hTL1A/hIL23A/hIL12B mice.
