

C57BL/6-Glp1rtm1(GLP1R)Bcgen Gcgrtm1(GCGR)Bcgen/Bcgen • 121837
| Product name | B-hGLP1R/hGCGR mice |
|---|---|
| Catalog number | 121837 |
| Strain name | C57BL/6-Glp1rtm1(GLP1R)Bcgen Gcgrtm1(GCGR)Bcgen/Bcgen |
| Strain background | C57BL/6 |
| Aliases | GLP-1; GLP-1R; GLP-1-RGGR; GL-R |
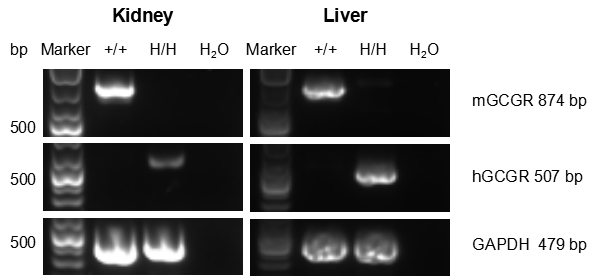
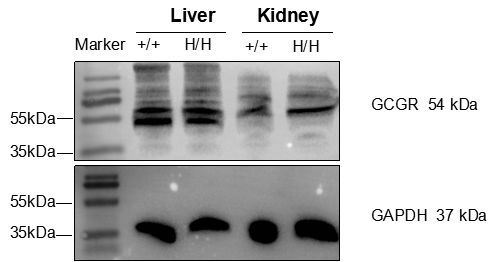
Gene targeting strategy for B-hGLP1R/hGCGR mice. The full coding sequence of human GLP1R gene was inserted into mouse Glp1r gene in B-hGLP1R/hGCGR mice. The exons 2-14 of mouse Gcgr gene that encode the full-length protein were replaced by human GCGR exons 2-14 in B-hGLP1R/hGCGR mice.
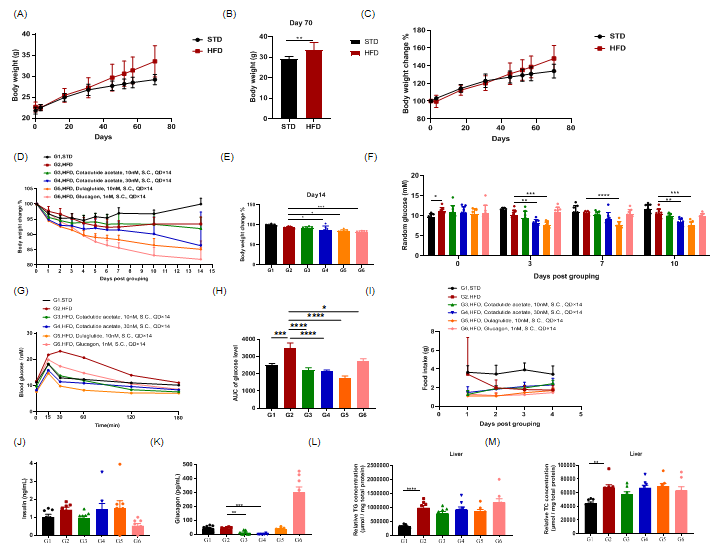
In vivo efficacy of cotadutide on B-hGLP1R/hGCGR mice DIO model. (A,C) Body weight and its’ change from baseline (%) during HFD induced. (B) Body weight before grouping. (D) Body weight change in grouping day and (E) experiment endpoint. (F) Random blood glucose on day 0, 3, 7, 10 after grouping. (G) Blood glucose profile following intraperitoneal injection of 1.25 g/kg glucose on day 12 after dosing. (H) Area under the IPGTT curve. (I) Cumulative food intake over the first 4 day of dosing. (J) Plasma insulin, (K) glucagon,(L) TG (triglycerides) and TC (cholesterol) level of liver on 20 hours after administration of the final dose. As shown in the panel, mouse body weight has increased under a high-fat diet. Following dosing with reagents in the panel, body weight and random blood glucose have reduced in the 30nM cotadutide treatment group but not obviously in the 10nM cotadutide group. During intraperitoneal glucose tolerance test (IPGTT), cotadutide reduced blood glucose. Whereas food intake has no differences among groups, and cotadutide shows a trend in reducing TG and TC level of liver in 10nM dose without statistical differences. As well as, the plasma insulin and glucagon show decreases trends. (ANOVA results,
*:P<0.05,**:P<0.01,***:P<0.001,****:P<0.0001)
