
C57BL/6-Mertktm2(MERTK)Bcgen/Bcgen • 111278
| Product name | B-hMERTK mice |
|---|---|
| Catalog number | 111278 |
| Strain name | C57BL/6-Mertktm2(MERTK)Bcgen/Bcgen |
| Strain background | C57BL/6N |
| NCBI gene ID | 17289 (Human) |
| Aliases | Mertk (Me; Ny; Eyk; Mer; Nyk; nmf1; nmf12) |
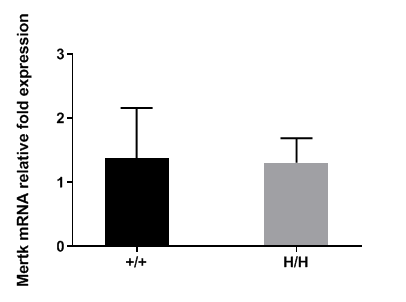
Analysis of MERTK gene expression in wild-type mice and B-hMERTK mice by q-PCR. The mRNA expression of MERTK in B-hMERTK (H/H) was similar to those in the wild-type mice (+/+), demonstrating that introduction of hMERTK in place of its mouse counterpart does not change the expression level of MERTK mRNA.
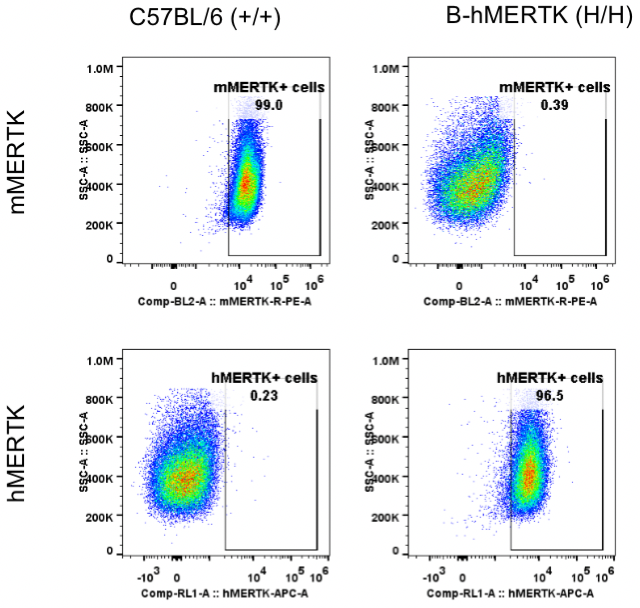
Strain specific MERTK expression analysis in homozygous B-hMERTK mice by flow cytometry. Peritoneal washes were collected from wild-type C57BL/6 mice (+/+) and homozygous B-hMERTK mice (H/H). Flow cytometry analysis of the macrophage was analyzed with species-specific anti-MERTK antibody. Mouse MERTK was detectable in wild-type mice. Human MERTK was only detectable in homozygote B-hMERTK mice but not in wild-type mice.
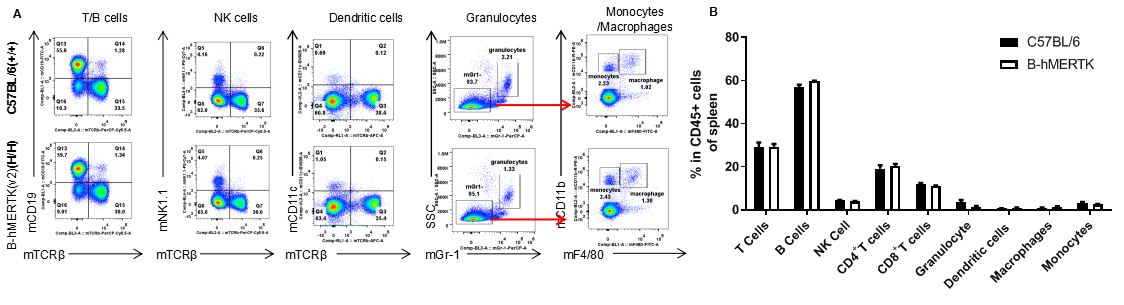
Analysis of spleen leukocyte subpopulations by FACS. Splenocytes were isolated from male C57BL/6 and B-hMERTK mice (n=3, 7-week-old). Flow cytometry analysis of the splenocytes was performed to assess leukocyte subpopulations. A. Representative FACS plots. Single live cells were gated for the CD45+ population and used for further analysis as indicated. B. Results of FACS analysis. The percentages of NK cells, dendritic cells, granulocytes, monocytes and macrophages in the homozygous B-hMERTK mice were similar to those in the C57BL/6 mice, demonstrating that the humanization of MERTK does not change the overall development, differentiation or distribution of these cell types in the spleen. Values are expressed as mean ± SEM.
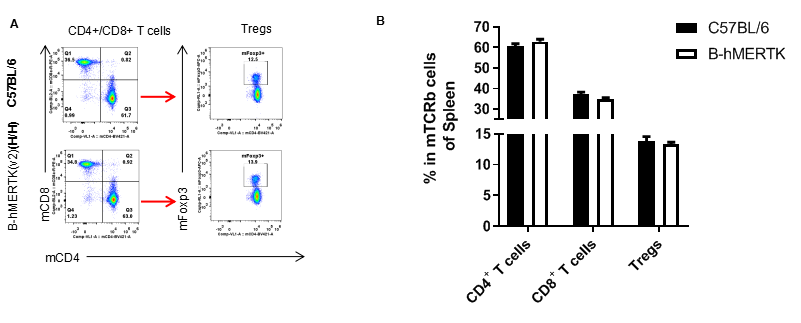
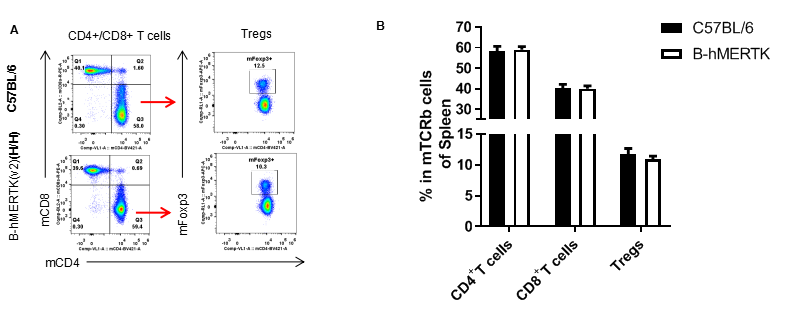
Analysis of spleen T cell subpopulations by FACS. Splenocytes were isolated from male C57BL/6 and B-hMERTK mice(n=3, 7-week-old). Flow cytometry analysis of the splenocytes was performed to assess leukocyte subpopulations. A. Representative FACS plots. Single live CD45+ cells were gated for T cell population and used for further analysis as indicated here. B. Results of FACS analysis. The percentages of CD8+ T cells, CD4+ T cells, and Tregs in the homozygous B-hMERTK mice were similar to those in the C57BL/6 mice, demonstrating that introduction of human MERTK in place of its murine counterpart does not change the overall development, differentiation or distribution of these T cell subtypes in the spleen. Values are expressed as mean ± SEM.
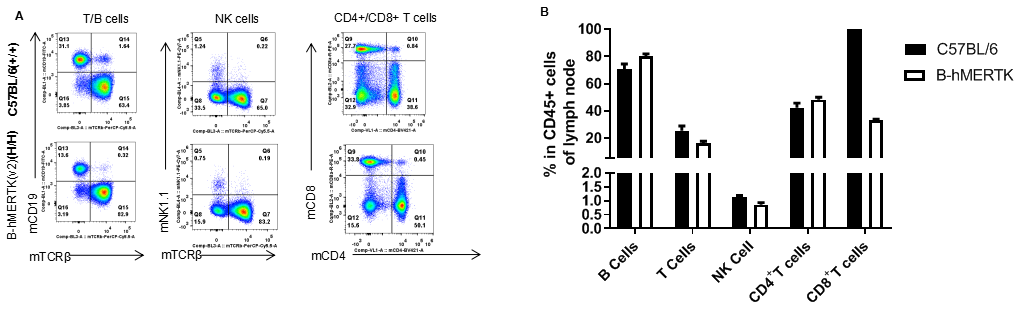
Analysis of lymph node leukocyte subpopulations by FACS. Leukocytes were isolated from male C57BL/6 and B-hMERTK mice(n=3, 7-week-old) Flow cytometry analysis of the leukocytes was performed to assess leukocyte subpopulations. A. Representative FACS plots. Single live cells were gated for CD45+ population and used for further analysis as indicated here. B. Results of FACS analysis. The percentages of T cells, B cells, and NK cells in the homozygous B-hMERTK mice were similar to those in the C57BL/6 mice, demonstrating that introduction of the human MERTK in place of its murine counterpart does not change the overall development, differentiation or distribution of these cell types in the lymph node. Values are expressed as mean ± SEM.
Analysis of lymph node leukocyte subpopulations by FACS. Leukocytes were isolated from male C57BL/6 and B-hMERTK mice(n=3, 7- week-old) Flow cytometry analysis of the leukocytes was performed to assess leukocyte subpopulations. Representative FACS plots. Single live CD45+ cells were gated for TCRb+ T cell population and used for further analysis as indicated here. B. Results of FACS analysis. The percentages of CD8+ T cells, and CD4+ T cells in the homozygous B-hMERTK mice were similar to those in the C57BL/6 mice, demonstrating that introduction of the human MERTK in place of its murine counterpart does not change the overall development, differentiation or distribution of these cell types in the lymph node. Values are expressed as mean ± SEM.
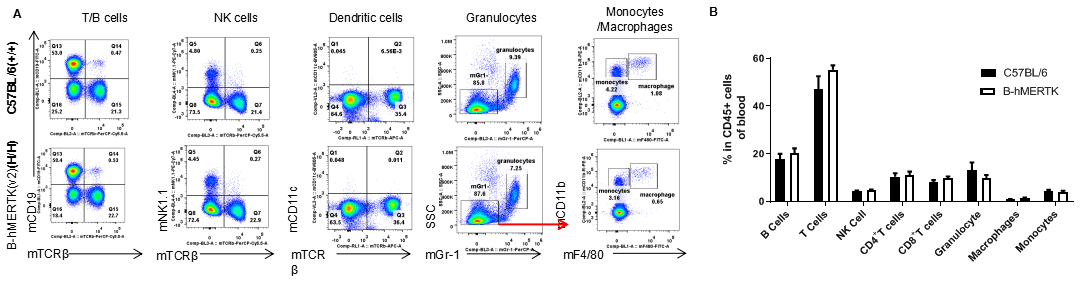
Analysis of blood leukocyte subpopulations by FACS. The blood cells were isolated from male C57BL/6 and B-hMERTK mice (n=3, 7-week-old) Flow cytometry analysis of the leukocytes was performed to assess leukocyte subpopulations. A. Representative FACS plots. Single live cells were gated for CD45+ population and used for further analysis as indicated here. B. Results of FACS analysis. The percentages of T cells, B cells, NK cells, dendritic cells, granulocytes, monocytes and macrophages in the homozygous B-hMERTK mice were similar to those in the C57BL/6 mice, demonstrating that introduction of the human MERTK in place of its murine counterpart does not change the overall development, differentiation or distribution of these cell types in the blood. Values are expressed as mean ± SEM.
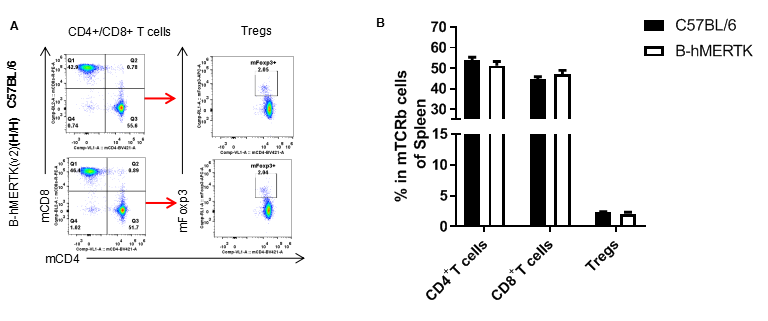
Analysis of blood leukocyte subpopulations by FACS. The blood cells were isolated from male C57BL/6 and B-hMERTK mice (n=3, 7-week-old) Flow cytometry analysis of the leukocytes was performed to assess leukocyte subpopulations. Representative FACS plots. Single live CD45+ cells were gated for TCRb+ T cell population and used for further analysis as indicated here. B. Results of FACS analysis. The percentages of CD4+, CD8+, Tregs in homozygous B-hMERTK mice were similar to those in the C57BL/6 mice, demonstrating that introduction of B-hMERTK in place of its mouse counterpart does not change the overall development, differentiation or distribution of these cell types in blood. Values are expressed as mean ± SEM.