C57BL/6-Pdcd1tm1(PDCD1)Bcgen Lag3tm1(LAG3)Bcgen Havcr2tm1(HAVCR2)Bcgen/Bcgen • 130999
| Product name | B-hPD-1/hLAG3/hTIM3 mice |
|---|---|
| Catalog number | 130999 |
| Strain name | C57BL/6-Pdcd1tm1(PDCD1)Bcgen Lag3tm1(LAG3)Bcgen Havcr2tm1(HAVCR2)Bcgen/Bcgen |
| Strain background | C57BL/6 |
| NCBI gene ID | 18566,16768,171285 (Human) |
| Aliases | PDCD1: PD-1; LAG3: CD223; HAVCR2: TIM3 |
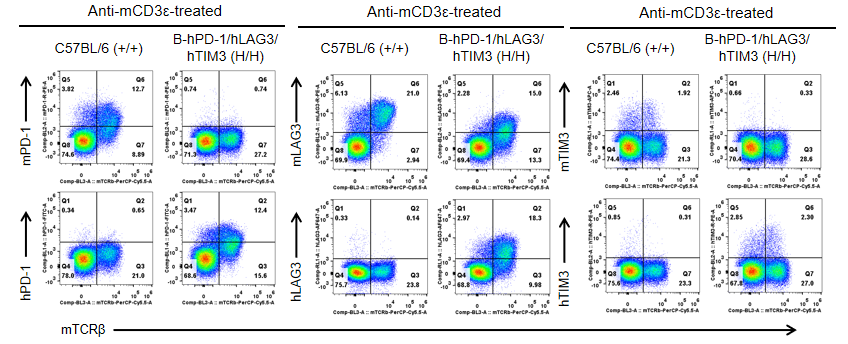
Strain specific PD-1, LAG3 and TIM3 expression analysis in homozygous B-hPD-1/hLAG3/hTIM3 mice by flow cytometry. Splenocytes from both wild type (+/+) C57BL/6 and homozygous B-hPD-1/hLAG3/hTIM3 (H/H) mice stimulated with anti-CD3ε in vivo, and analyzed by flow cytometry. Mouse PD-1+ and TIM3+ T cells were only detectable in the WT C57BL/6 mice, human PD-1+, TIM3+ and LAG3+ T cells were only detectable in the homozygous B-hPD-1/hLAG3/hTIM3 mice. Mouse LAG3+ T cells were detectable in WT and homozygous B-hPD-1/hLAG3/hTIM3 mice, as the anti-mLAG3 antibody cross reacts with hLAG3.
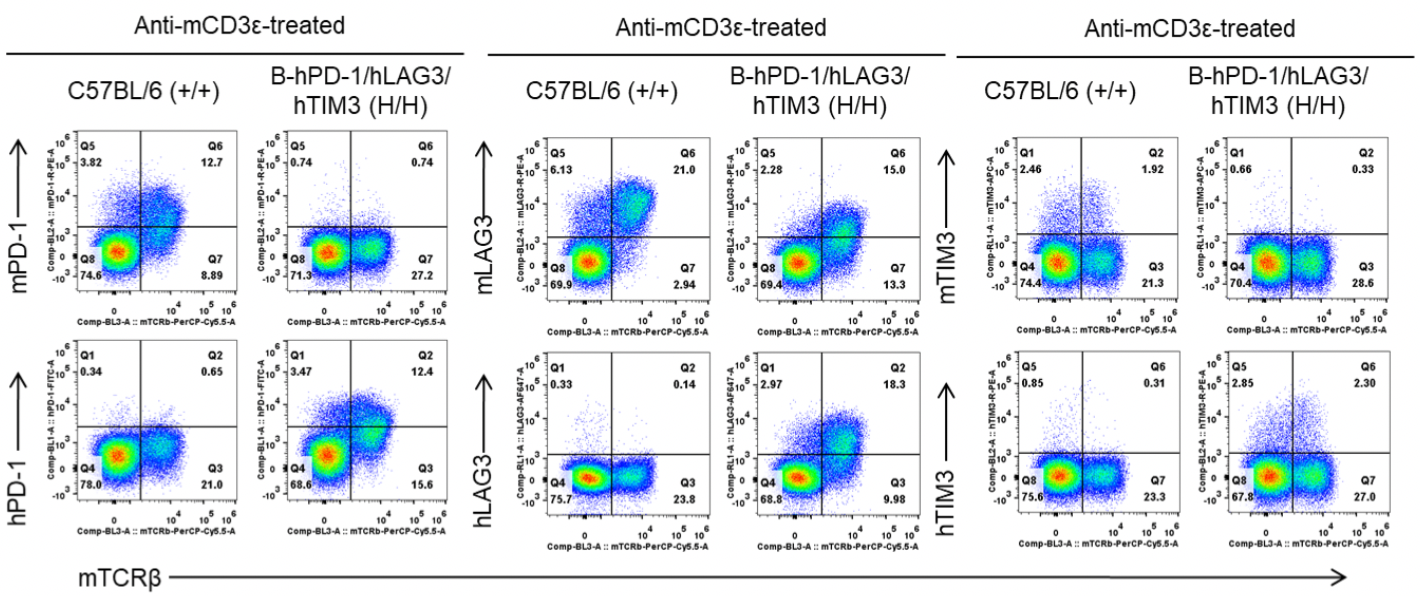
Strain specific PD-1, LAG3 and TIM3 expression analysis in homozygous B-hPD-1/hLAG3/hTIM3 mice by flow cytometry. Splenocytes from both wild type (+/+) C57BL/6 and homozygous B-hPD-1/hLAG3/hTIM3 (H/H) mice stimulated with anti-CD3ε in vivo, and analyzed by flow cytometry. Mouse PD-1+ and TIM3+ T cells were only detectable in the WT C57BL/6 mice, human PD-1+, TIM3+ and LAG3+ T cells were only detectable in the homozygous B-hPD-1/hLAG3/hTIM3 mice. Mouse LAG3+ T cells were detectable in WT and homozygous B-hPD-1/hLAG3/hTIM3 mice, as the anti-mLAG3 antibody cross reacts with hLAG3.
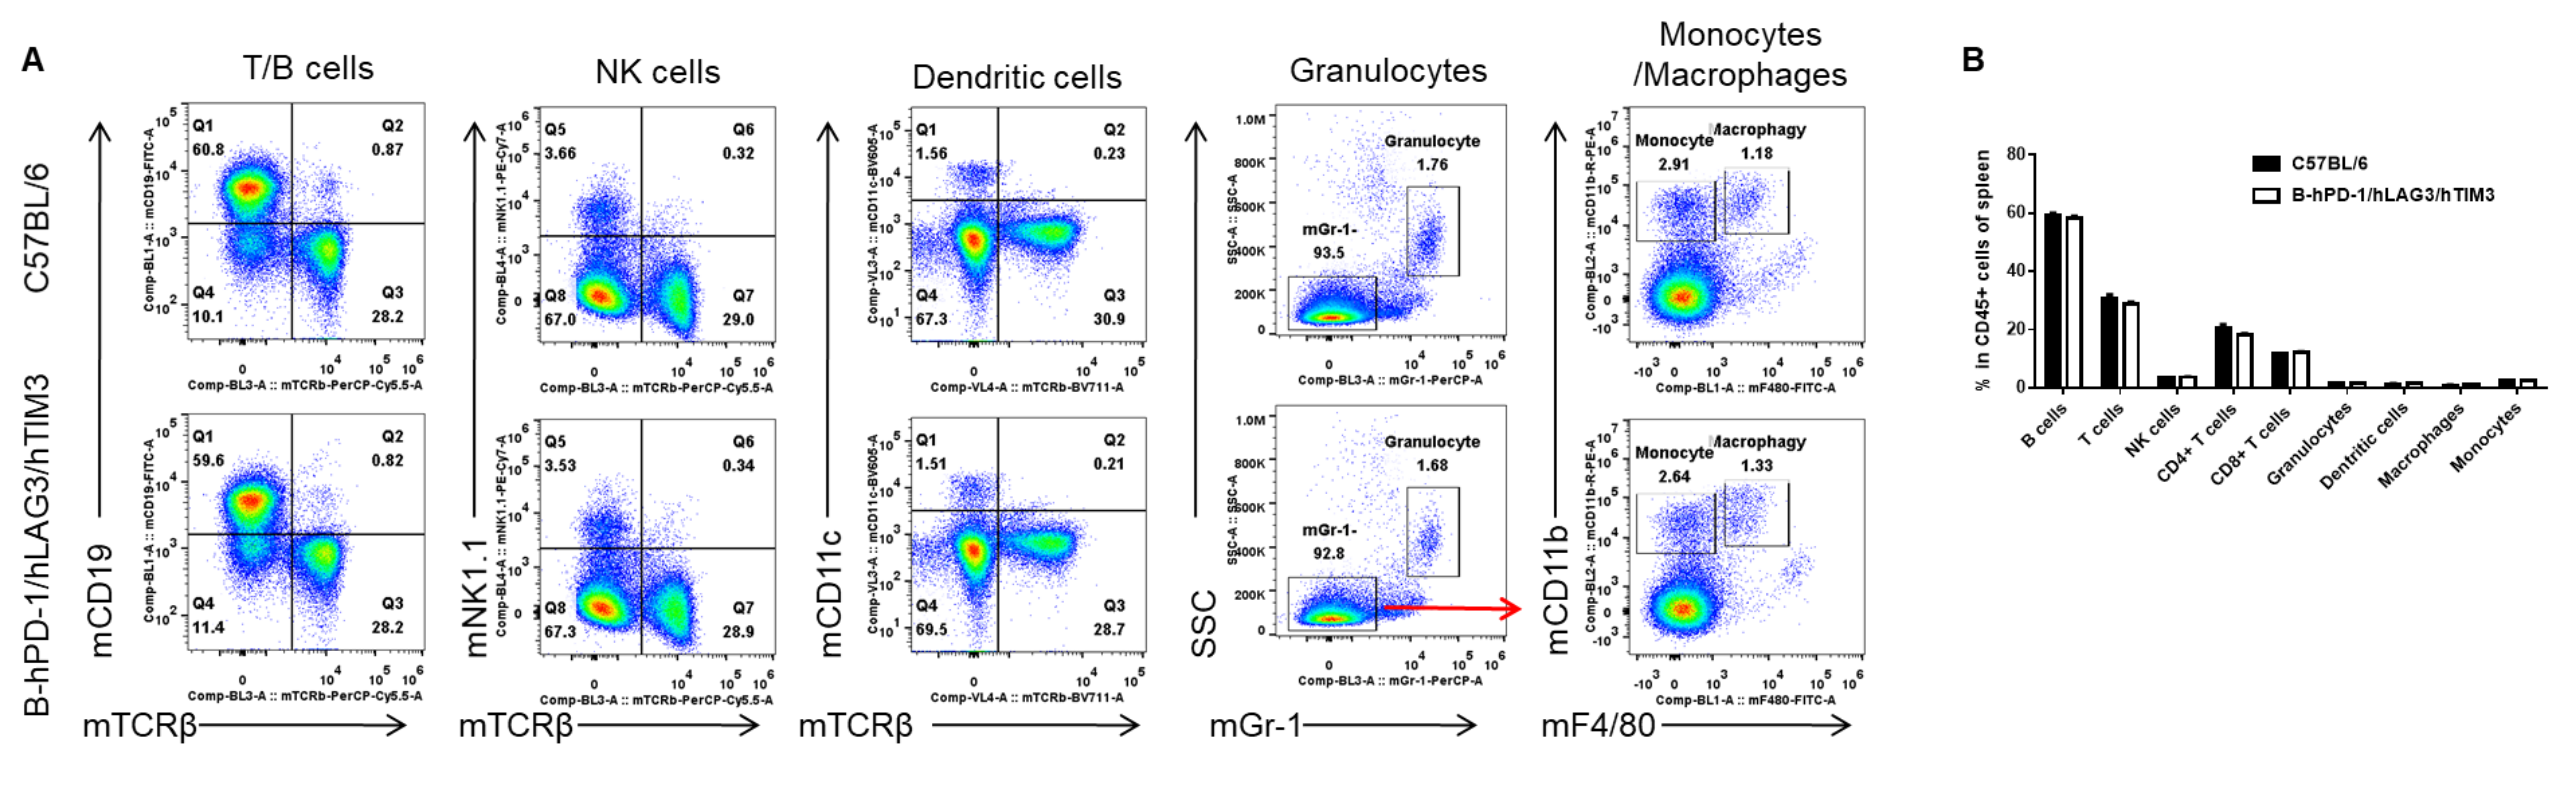
Analysis of spleen leukocyte subpopulations by FACS. Splenocytes were isolated from female C57BL/6 and B-hPD-1/hLAG3/hTIM3 mice (n=3, 6-week-old). Flow cytometry analysis of the splenocytes was performed to assess leukocyte subpopulations. A. Representative FACS plots. Single live cells were gated for CD45 population and used for further analysis as indicated here. B. Results of FACS analysis. Percent of T cells, B cells, NK cells, monocytes, Dendritic cells, granulocytes and macrophages in homozygous B-hPD-1/hLAG3/hTIM3 mice were similar to those in the C57BL/6 mice, demonstrating that introduction of hPD-1,hLAG3 and hTIM3 in place of its mouse counterpart does not change the overall development, differentiation or distribution of these cell types in spleen. Values are expressed as mean ± SEM.