

C57BL/6-Pdcd1tm1(PDCD1)Bcgen Cd274tm1(CD274)BcgenCD40tm1(CD40)Bcgen/Bcgen • 131083
| Product name | B-hPD-1/hPD-L1/hCD40 mice |
|---|---|
| Catalog number | 131083 |
| Strain name | C57BL/6-Pdcd1tm1(PDCD1)Bcgen Cd274tm1(CD274)BcgenCD40tm1(CD40)Bcgen/Bcgen |
| Strain background | C57BL/6 |
| NCBI gene ID | 18566,60533,21939 |
| Aliases | PD-1 (Programmed death-1); CD274 (CD274 antigen); CD40 (CD40 antigen) |
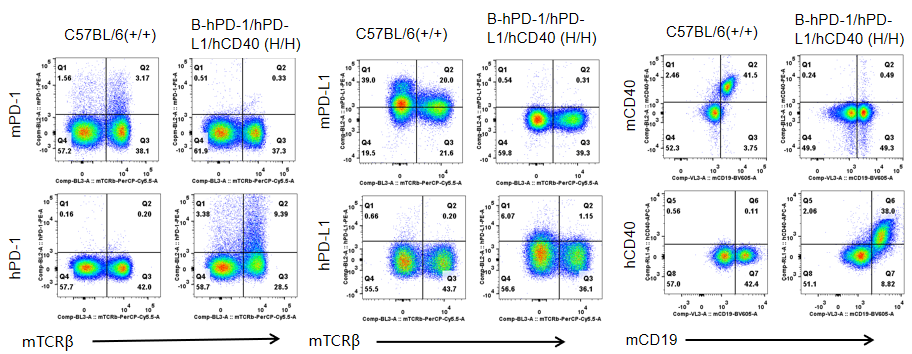
Strain specific PD-1, PD-L1 and CD40 expression analysis in homozygous B-hPD-1/hPD-L1/hCD40 mice by flow cytometry. Splenocytes were collected from WT and homozygous B-hPD-1/hPD-L1/hCD40 (H/H) mice analyzed by flow cytometry with species-specific anti-PD-1 antibody. Mouse PD-1, PD-L1 and CD40 were detectable in WT mice. Human PD-1, PD-L1 and CD40 were exclusively detectable in homozygous B-hPD-1/hPD-L1/hCD40 but not WT mice.
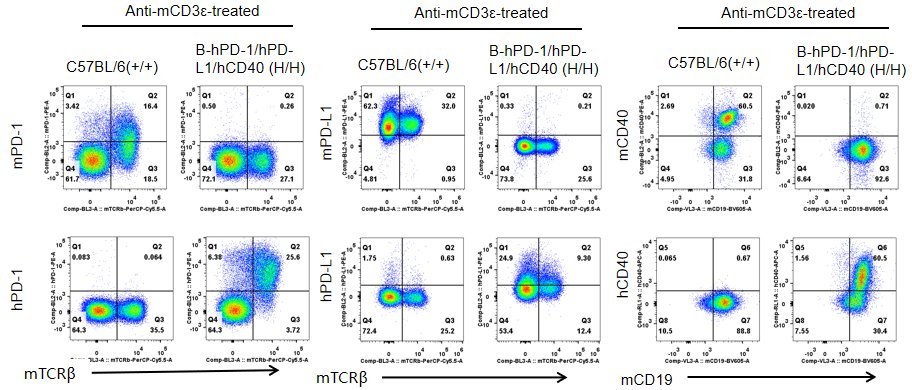
Strain specific PD-1, PD-L1 and CD40 expression analysis in homozygous B-hPD-1/hPD-L1/hCD40 mice by flow cytometry. Splenocytes were collected from WT and homozygous B-hPD-1/hPD-L1/hCD40 (H/H) mice after stimulation with anti-CD3ε in vivo (7.5 μg/mice), and without stimulation, and analyzed by flow cytometry with species-specific anti-PD-1 antibody. Mouse PD-1, PD-L1 and CD40 were detectable in WT mice. Human PD-1, PD-L1 and CD40 were exclusively detectable in homozygous B-hPD-1/hPD-L1/hCD40 but not WT mice. After anti-CD3ε stimulation, hPD-1 protein expression was significantly increased.
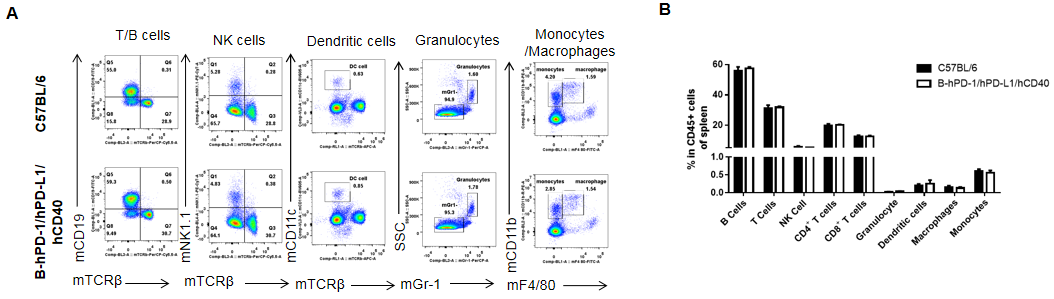
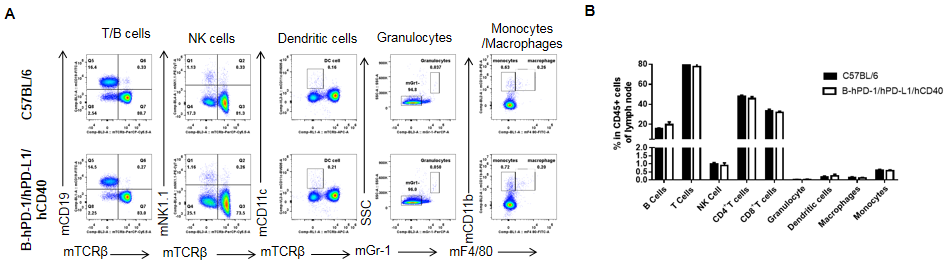
Analysis of spleen leukocyte subpopulations by FACS. Splenocytes were isolated from female C57BL/6 and B-hPD-1/hPD-L1/hCD40 mice (n=3, 7-week-old). Flow cytometry analysis of the splenocytes was performed to assess leukocyte subpopulations. A. Representative FACS plots. Single live cells were gated for the CD45+ population and used for further analysis as indicated here. B. Results of FACS analysis. Percent of T cells, B cells, NK cells, dendritic cells, granulocytes, monocytes and macrophages in homozygous B-hPD-1/hPD-L1/hCD40 mice were similar to those in the C57BL/6 mice, demonstrating that introduction of hPD-1/hPD-L1/hCD40 in place of their mouse counterpart does not change the overall development, differentiation or distribution of these cell types in spleen. Values are expressed as mean ± SEM.
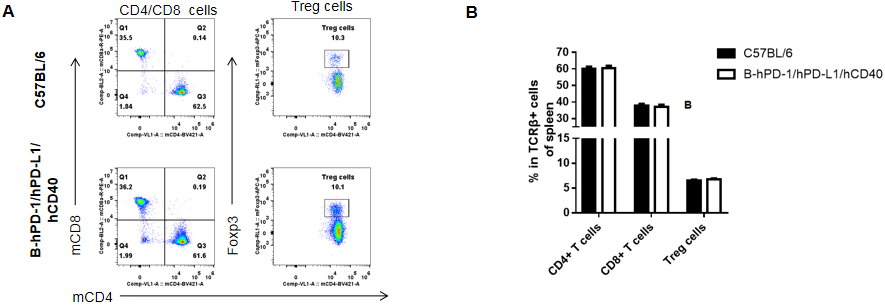
Analysis of spleen T cell subpopulations by FACS. Splenocytes were isolated from female C57BL/6 and B-hPD-1/hPD-L1/hCD40 mice(n=3, 7-week-old). Flow cytometry analysis of the splenocytes was performed to assess leukocyte subpopulations. A. Representative FACS plots. Single live CD45+ cells were gated for TCRβ+ T cell population and used for further analysis as indicated here. B. Results of FACS analysis. The percent of CD8+ T cells, CD4+ T cells, and Tregs in homozygous B-hPD-1/hPD-L1/hCD40 mice were similar to those in the C57BL/6 mice, demonstrating that introduction of hPD-1/hPD-L1/hCD40 in place of their mouse counterpart does not change the overall development, differentiation or distribution of these T cell subtypes in spleen. Values are expressed as mean ± SEM.
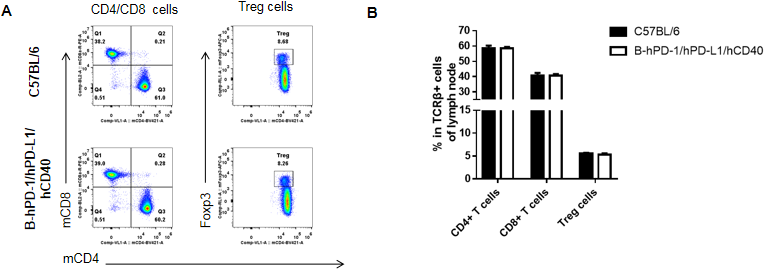
Analysis of lymph node T cell subpopulations by FACS. Leukocytes were isolated from female C57BL/6 and B-hPD-1/hPD-L1/hCD40 mice(n=3, 7-week-old). Flow cytometry analysis of the leukocytes was performed to assess leukocyte subpopulations. A. Representative FACS plots. Single live CD45+ cells were gated for TCRβ+ T cell population and used for further analysis as indicated here. B. Results of FACS analysis. The percent of CD8+ T cells, CD4+ T cells, and Tregs in homozygous B-hPD-1/hPD-L1/hCD40 mice were similar to those in the C57BL/6 mice, demonstrating that introduction of hPD-1/hPD-L1/hCD40 in place of their mouse counterpart does not change the overall development, differentiation or distribution of these T cell subtypes in lymph node. Values are expressed as mean ± SEM.
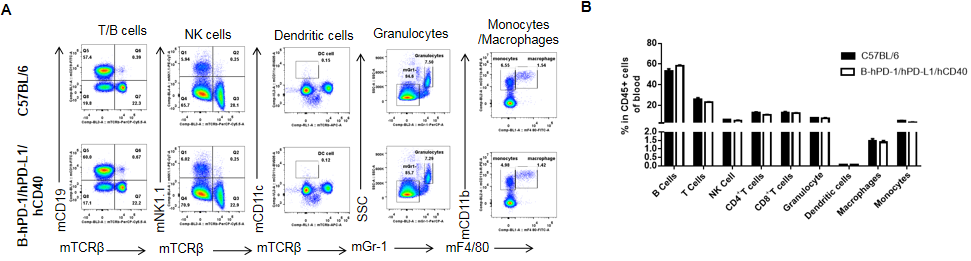
Analysis of blood leukocyte subpopulations by FACS. Blood cells were isolated from female C57BL/6 and B-hPD-1/hPD-L1/hCD40 mice(n=3, 7-week-old). Flow cytometry analysis of the splenocytes was performed to assess leukocyte subpopulations. A. Representative FACS plots. Single live cells were gated for the CD45+ population and used for further analysis as indicated here. B. Results of FACS analysis. Percent of T cells, B cells, NK cells, dendritic cells, granulocytes, monocytes and macrophages in homozygous B-hPD-1/hPD-L1/hCD40 mice were similar to those in the C57BL/6 mice, demonstrating that introduction of hPD-1/hPD-L1/hCD40 in place of their mouse counterpart does not change the overall development, differentiation or distribution of these cell types in blood. Values are expressed as mean ± SEM.
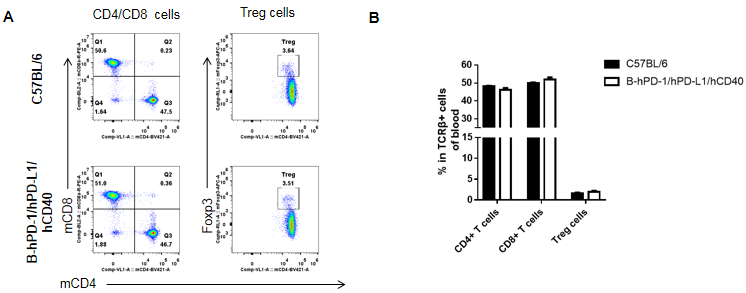
Analysis of blood T cell subpopulations by FACS. Blood cells were isolated from female C57BL/6 and B-hPD-1/hPD-L1/hCD40 mice(n=3, 7-week-old). Flow cytometry analysis of the splenocytes was performed to assess leukocyte subpopulations. A. Representative FACS plots. Single live CD45+ cells were gated for TCRβ+ T cell population and used for further analysis as indicated here. B. Results of FACS analysis. The percent of CD8+ T cells, CD4+ T cells, and Tregs in homozygous B-hPD-1/hPD-L1/hCD40 mice were similar to those in the C57BL/6 mice, demonstrating that introduction of hPD-1/hPD-L1/hCD40 in place of their mouse counterpart does not change the overall development, differentiation or distribution of these T cell subtypes in blood. Values are expressed as mean ± SEM.
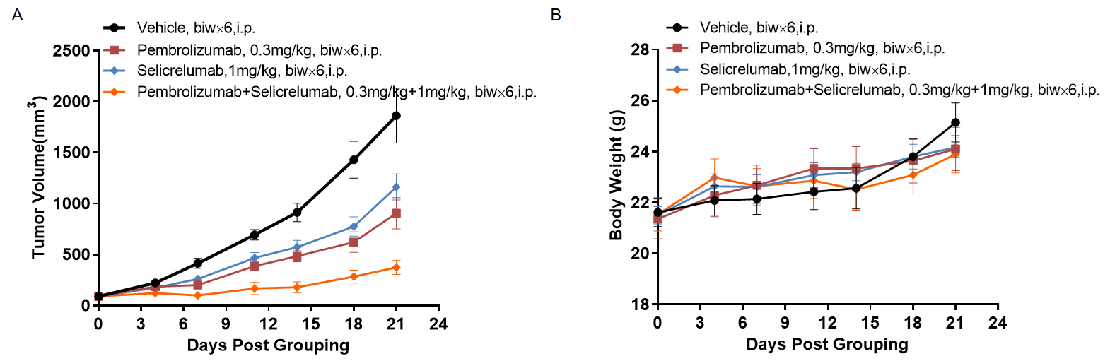
Antitumor activity of of Pembrolizumab and Selicrelumab in B-hPD-1/hPD-L1/hCD40 mice. (A) anti-human PD-1 antibody combined with anti-human CD40 antibody inhibited MC38-hPD-L1 tumor growth in B-hPD-1/hPD-L1/hCD40 mice. Murine colon cancer MC38-hPD-L1 cells (5×10⁵) were subcutaneously implanted into homozygous B-hPD-1/hPD-L1/hCD40 mice(female, 7 week-old, n=5). Mice were grouped when tumor volume reached approximately 100-150 mm3, at which time they were treated with Pembrolizumab and Selicrelumab with doses and schedules indicated in panel A. (B) Body weight changes durin g treatment. As shown in panel A, combination of Pembrolizumab and Selicrelumab shows more inhibitory effects than individual groups, demonstrating that the B-hPD-1/hPD-L1/hCD40 mice provide a powerful preclinical model for in vivo evaluating combination therapy efficacy of PD-1 antibodies combined with anti-human CD40 antibodies. Values are expressed as mean ± SEM.(All antibodies were made in house)
