C57BL/6-Mapttm1(MAPT)Bcgen/Bcgen • 110953
| Product name | B-hTAU mice |
|---|---|
| Catalog number | 110953 |
| Strain name | C57BL/6-Mapttm1(MAPT)Bcgen/Bcgen |
| Strain background | C57BL/6 |
| Aliases | TAU, MSTD, PPND, DDPAC, MAPTL, MTBT1, MTBT2, tau-40, FTDP-17, PPP1R103, Tau-PHF6 |
| Application | This product is used for pharmacodynamics and safety evaluation of Alzheimer's disease (AD). |
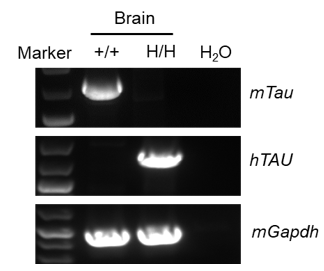
Strain specific analysis of TAU mRNA expression in wild-type C57BL/6 mice and B-hTAU mice by RT-PCR. Brain RNA were isolated from wild-type C57BL/6 mice (+/+) and homozygous B-hTAU mice (H/H), then cDNA libraries were synthesized by reverse transcription, followed by PCR with mouse or human TAU primers. Human TAU mRNA was detectable only in homozygous B-hTAU mice but not in wild-type mice.
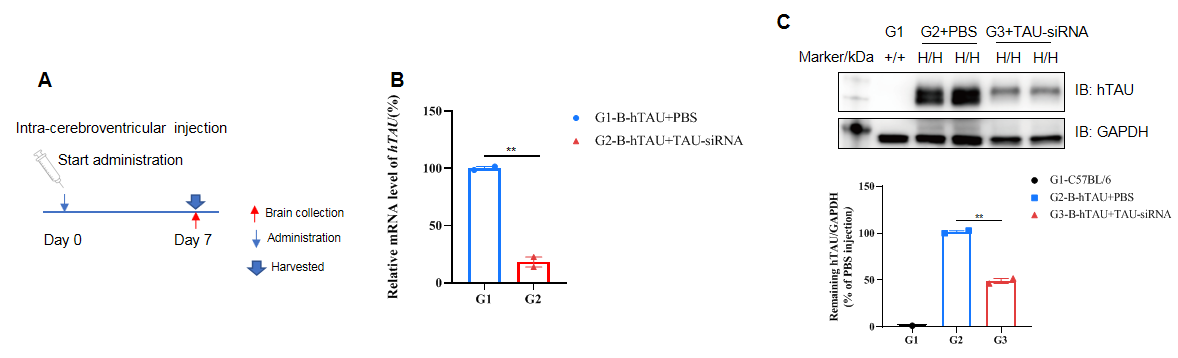
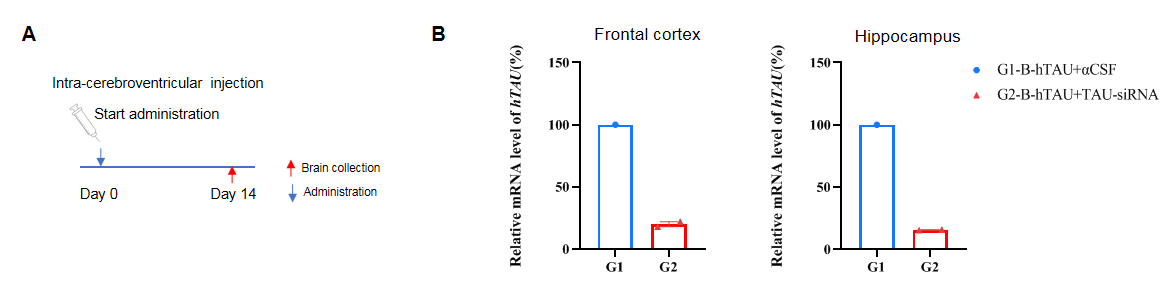
The inhibitory efficiency of the nucleic acid drugs against human TAU in B-hTAU mice. B-hTAU mice were randomly divided into two groups (n=2/group, 6 weeks old, male). The human TAU targeted nucleic acid drugs (from client) and PBS were administered to the mice individually. The mice were sacrificed on day 7, and the brain tissue was collected to detect the human TAU mRNA and protein expression by qRT-PCR and western blot, respectively. (A) The schematic diagram of experimental processing. (B) The expression of human TAU mRNA in brain. The human TAU in the treatment group (G2) was significantly reduced compared to the control group (G1). (C) The expression of human TAU protein in brain. Compared with the control group (G2), the treatment group (G3) showed a significant decrease in hTAU and the inhibition rate in the treatment group was 51.5%, demonstrating that B-hTAU mice provide a powerful preclinical model for in vivo evaluation of human TAU targeted nucleic acid drugs. Values are expressed as mean ± SEM. Validation data was supplied by client.