

SD-Tfrctm1(TFRC)Bcgen/Bcgen • 113101
| Product name | B-hTFR1 rats |
|---|---|
| Catalog number | 113101 |
| Strain name | SD-Tfrctm1(TFRC)Bcgen/Bcgen |
| Strain background | SD |
| NCBI gene ID | 7037 |
| Aliases | CD71, IMD46, T9, TFR, TFR1, TR, TRFR, p90 |
on this page
Gene targeting strategy for B-hTFR1 rats. A chimeric CDS that encodes human TFR1 extracellular domain, rat TFR1 transmembrane and cytoplasmic domain, followed by human 3’UTR-STOP and SV40 polyA is inserted right after rat Tfr1 ATG to replace the exon 2 of rat Tfr1 gene. The chimeric TFR1 protein expression will be driven by endogenous rat Tfr1 promoter, while rat Tfr1 gene transcription and translation will be disrupted.
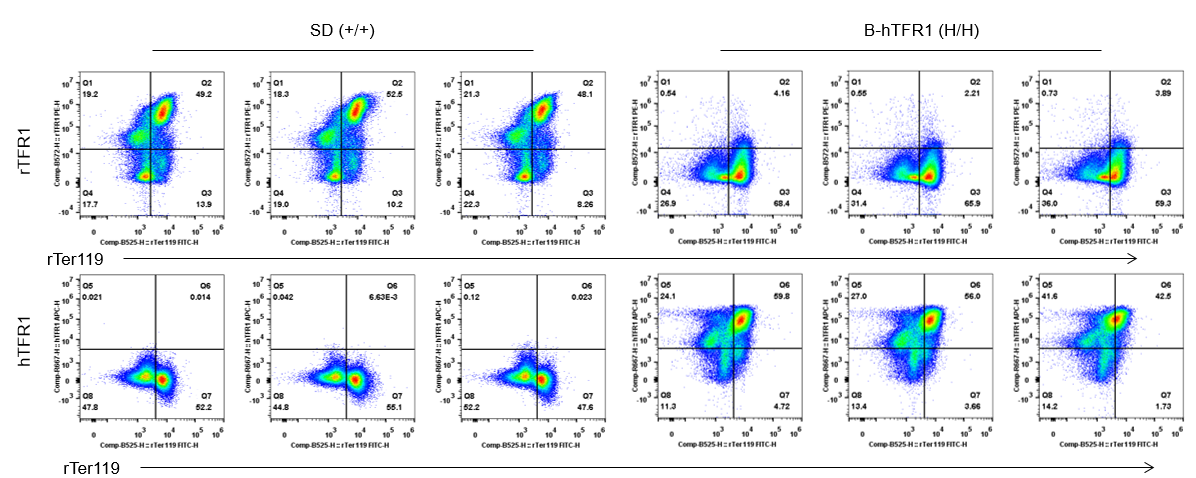
Strain specific TFR1 expression analysis in homozygous B-hTFR1 rats by flow cytometry. Bone marrow were collected from wild-type SD rats (+/+) and homozygous B-hTFR1 rats (H/H). Protein expression was analyzed with anti-rat TFR1 antibody (Biolegend, 204410) and anti-human TFR1 antibody (Biolegend, 334107) by flow cytometry. Rat TFR1 was only detectable in wild-type SD rats. Human TFR1 was exclusively detectable in homozygous B-hTFR1 rats.
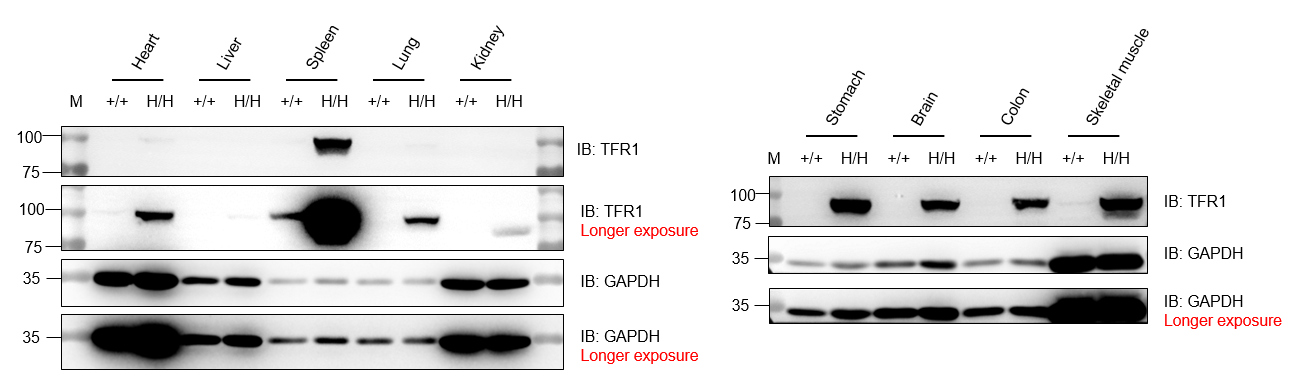
Western blot analysis of TFR1 protein expression in wild-type SD rats and homozygous B-hTFR1 rats by WB. Various tissues were collected from wild-type SD rats (+/+) and homozygous B-hTFR1 rats (H/H), and then analyzed by western blot with anti-TFR1 antibody (abcam, ab214039). 40 μg total proteins were loaded for western blotting analysis. GAPDH were detected as internal control. hTFR1 was exclusively detectable in heart, spleen, lung, kidney, stomach, brain, colon and skeletal muscle from homozygous B-hTFR1 rats. M, marker.
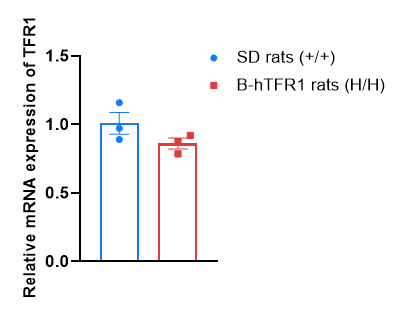
Strain specific analysis of TFR1 mRNA expression in wild-type SD rats and B-hTFR1 rats by RT-qPCR. All the rats were perfused with PBS and then scarified. Then brain RNA were isolated from wild-type SD rats (+/+) and homozygous B-hTFR1 rats (H/H) (n=3, 5-week-old, male), then cDNA libraries were synthesized by reverse transcription, followed by PCR with TFR1 primers. TFR1 expression levels in brain from homozygous B-hTFR1 rats was comparable with that in wild-type SD rats.
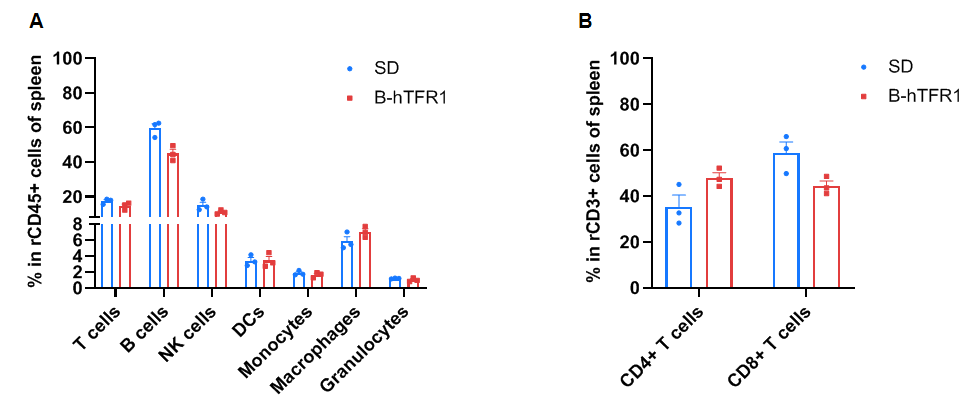
Frequency of leukocyte subpopulations in spleen by flow cytometry. Splenocytes were isolated from wild-type SD rats (+/+) (male, n=3, 6-week-old) and homozygous B-hTFR1 rats (H/H) (male, n=3, 6-week-old). A. Flow cytometry analysis of the splenocytes was performed to assess the frequency of leukocyte subpopulations. B. Frequency of T cell subpopulations. Percentages of T cells, CD4+ T cells, CD8+ T cells, B cells, NK cells, DCs, monocytes, macrophages and granulocytes in homozygous B-hTFR1 rats were similar to those in SD rats. The frequency of leukocyte subpopulations in blood and lymph nodes of B-hTFR1 rats were also comparable to wild-type SD rats (Data not shown). Values are expressed as mean ± SEM. Significance was determined by two-way ANOVA test. *P < 0.05, **P < 0.01, ***p < 0.0001.
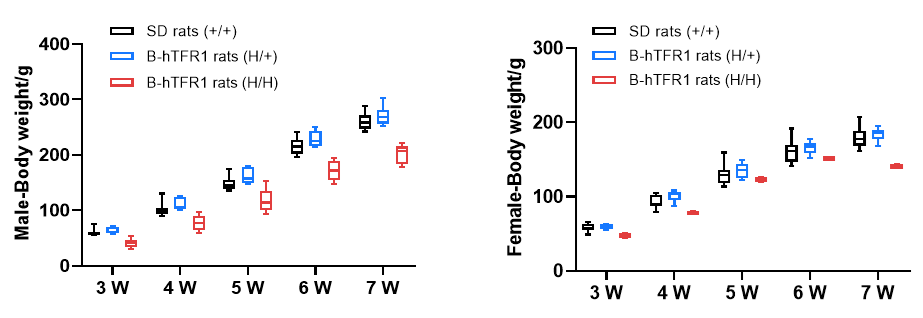
The homozygous B-hTFR1 rats (H/H) are smaller in size compared to the wild-type SD rats (+/+) and heterozygous B-hTFR1 rats (H/+).
