

C57BL/6-Tg(RP11-634C1)1(CH17-401N15)1Bcgen/Bcgen • 112332
| Product name | B-Tg(hLILRB2/hLILRB3/hLILRB1/hLILRB4) mice |
|---|---|
| Catalog number | 112332 |
| Strain name | C57BL/6-Tg(RP11-634C1)1(CH17-401N15)1Bcgen/Bcgen |
| Strain background | C57BL/6N |
| Aliases | LILRB2: ILT4, LIR2, CD85D, ILT-4, LIR-2, MIR10, MIR-10; LILRB3: HL9, ILT5, LIR3, PIRB, CD85A, ILT-5, LIR-3, PIR-B, LILRA6; LILRB1: ILT2, LIR1, MIR7, PIRB, CD85J, ILT-2, LIR-1, MIR-7, PIR-B; LILRB4: ILT3, LIR5, CD85K, ILT-3, LIR-5 |
Gene targeting strategy for B-Tg(hLILRB2/hLILRB3/hLILRB1/hLILRB4) mice.
Bacterial artificial chromosome (BAC) clones for the human LILRB1, LILRB2, LILRB3 and LILRB4 genes were integrated into the mouse genome randomly.
Protein expression analysis
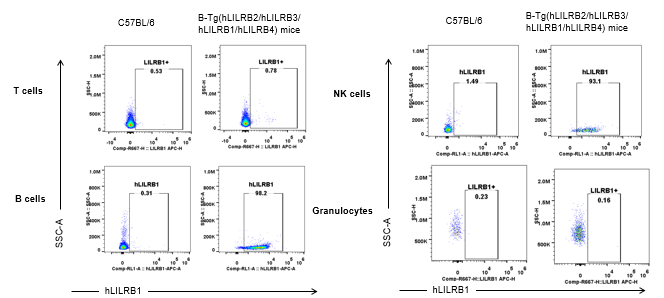
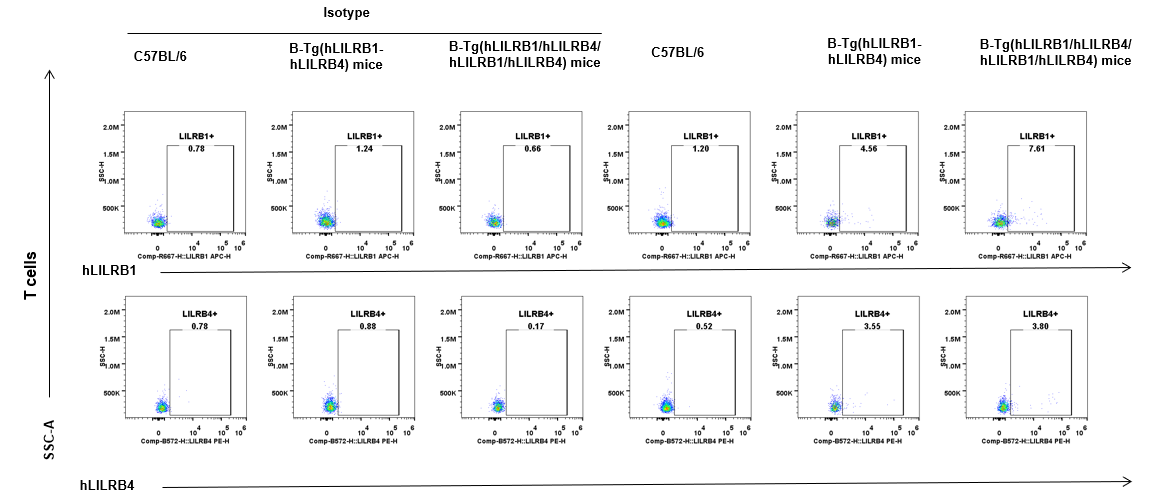
Strain specific hLILRB1 expression analysis in B-Tg(hLILRB2/hLILRB3/hLILRB1/hLILRB4) mice by flow cytometry. Blood were collected from wild-type (+/+) and transgenic B-Tg(hLILRB2/hLILRB3/hLILRB1/hLILRB4) mice (Tg), and analyzed by flow cytometry with species-specific anti-human LILRB1 antibody. Human LILRB1 was both detectable in B cells and NK cells from B-Tg(hLILRB1/hLILRB4) mice but not wild-type mice.
Strain specific hLILRB1 expression analysis in B-Tg(hLILRB2/hLILRB3/hLILRB1/hLILRB4) mice by flow cytometry. Blood were collected from wild-type (+/+) and transgenic B-Tg(hLILRB2/hLILRB3/hLILRB1/hLILRB4) mice (Tg), and analyzed by flow cytometry with species-specific anti-human LILRB1 antibody. Human LILRB1 was both detectable in DCs and macrophages from B-Tg(hLILRB1/hLILRB4) mice but not wild-type mice.
Protein expression analysis
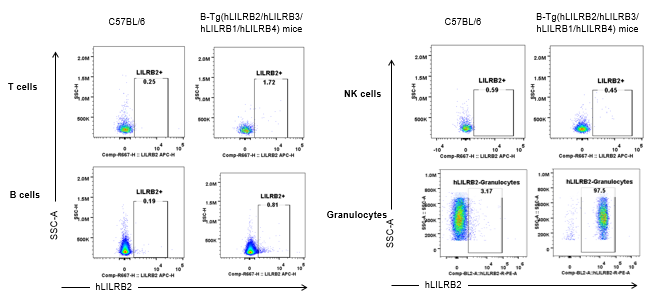
Strain specific hLILRB2 expression analysis in B-Tg(hLILRB2/hLILRB3/hLILRB1/hLILRB4) mice by flow cytometry. Blood cells were collected from wild-type (+/+) and transgenic B-Tg(hLILRB2/hLILRB3/hLILRB1/hLILRB4) mice (Tg), and analyzed by flow cytometry with species-specific anti-human LILRB2 antibody. Human LILRB2 was detectable in granulocytes from B-Tg(hLILRB1/hLILRB4) mice but not wild-type mice.
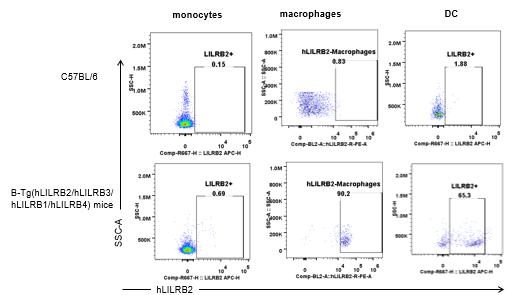
Strain specific hLILRB2 expression analysis in B-Tg(hLILRB2/hLILRB3/hLILRB1/hLILRB4) mice by flow cytometry. Blood cells were collected from wild-type (+/+) and transgenic B-Tg(hLILRB2/hLILRB3/hLILRB1/hLILRB4) mice (Tg), and analyzed by flow cytometry with species-specific anti-human LILRB2 antibody. Human LILRB2 was both detectable in DCs and macrophages from B-Tg(hLILRB1/hLILRB4) mice but not wild-type mice.
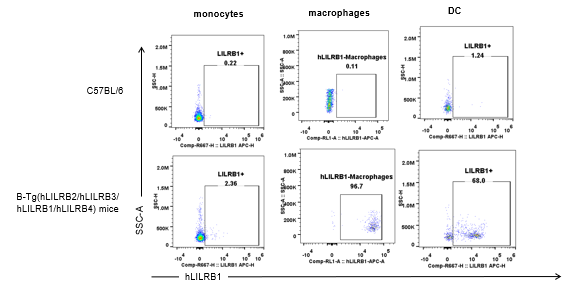
Protein expression analysis
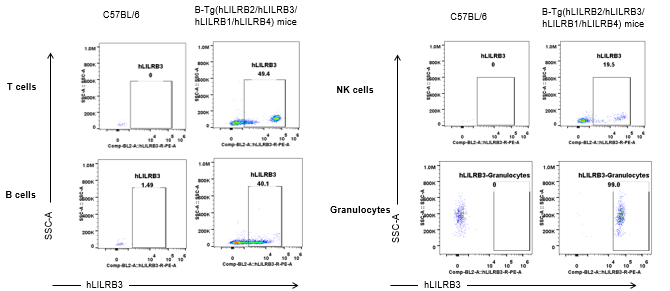
Strain specific hLILRB3 expression analysis in B-Tg(hLILRB2/hLILRB3/hLILRB1/hLILRB4) mice by flow cytometry. Blood cells were collected from wild-type (+/+) and transgenic B-Tg(hLILRB2/hLILRB3/hLILRB1/hLILRB4) mice (Tg), and analyzed by flow cytometry with species-specific anti-human LILRB3 antibody. Human LILRB3 was both detectable in T cells, B cells, NK cells and granulocytes from B-Tg(hLILRB1/hLILRB4) mice but not wild-type mice.
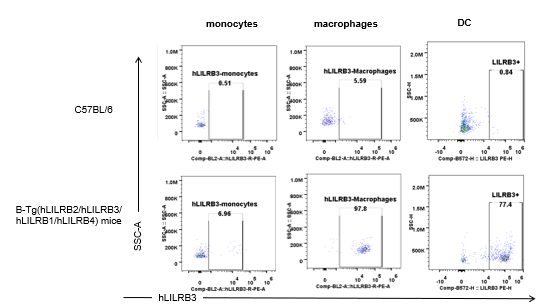
Strain specific hLILRB3 expression analysis in B-Tg(hLILRB2/hLILRB3/hLILRB1/hLILRB4) mice by flow cytometry. Blood cells were collected from wild-type (+/+) and transgenic B-Tg(hLILRB2/hLILRB3/hLILRB1/hLILRB4) mice (Tg), and analyzed by flow cytometry with species-specific anti-human LILRB3 antibody. Human LILRB3 was both detectable in monocytes, macrophages and DCs from B-Tg(hLILRB1/hLILRB4) mice but not wild-type mice.
Protein expression analysis
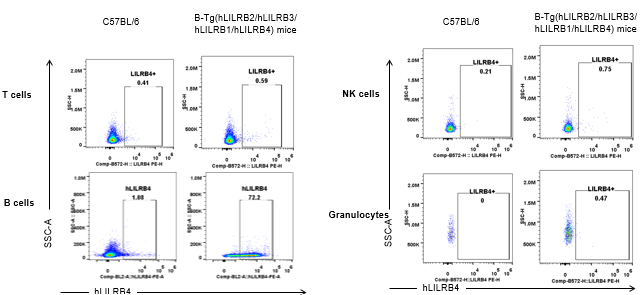
Strain specific hLILRB4 expression analysis in B-Tg(hLILRB2/hLILRB3/hLILRB1/hLILRB4) mice by flow cytometry. Blood cells were collected from wild-type (+/+) and transgenic B-Tg(hLILRB2/hLILRB3/hLILRB1/hLILRB4) mice (Tg), and analyzed by flow cytometry with species-specific anti-human LILRB4 antibody. Human LILRB4 was detectable in B cells from B-Tg(hLILRB1/hLILRB4) mice.
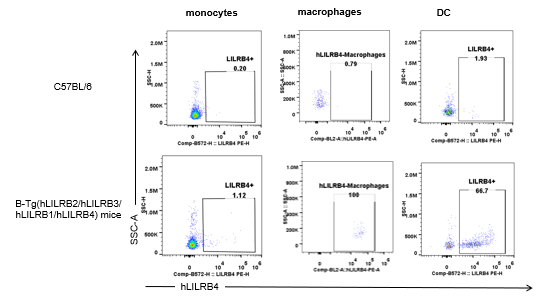
Strain specific hLILRB4 expression analysis in B-Tg(hLILRB2/hLILRB3/hLILRB1/hLILRB4) mice by flow cytometry. Blood cells were collected from wild-type (+/+) and transgenic B-Tg(hLILRB2/hLILRB3/hLILRB1/hLILRB4) mice (Tg), and analyzed by flow cytometry with species-specific anti-human LILRB4 antibody. Human LILRB4 was both detectable in DC and macrophages from B-Tg(hLILRB1/hLILRB4) mice.
Analysis of leukocytes cell subpopulation in spleen
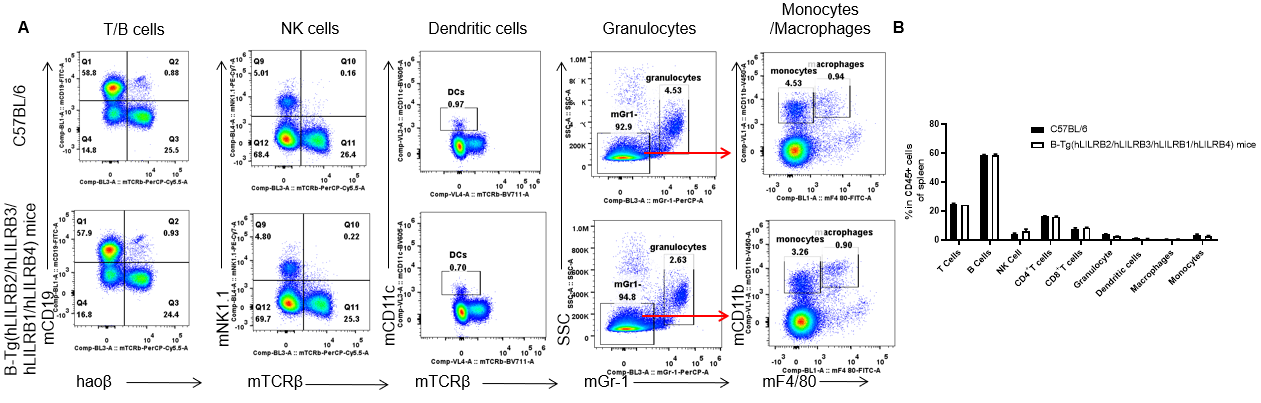
Analysis of the spleen leukocyte subpopulations by FACS. Splenocytes were isolated from female C57BL/6 and B-Tg(hLILRB2/hLILRB3/hLILRB1/hLILRB4) mice (n=3, 8-week-old). Flow cytometry analysis of the splenocytes was performed to assess leukocyte subpopulations. (A) Representative FACS plots. Single live cells were gated for the CD45+ population and used for further analysis as indicated. (B) Results of FACS analysis. The percentages of T cells, B cells, NK cells, dendritic cells, granulocytes, monocytes, and macrophages in B-Tg(hLILRB2/hLILRB3/hLILRB1/hLILRB4) mice were similar to those in the C57BL/6 mice, demonstrating that LILRB1, LILRB2, LILRB3, and LILRB4 humanized does not change the overall development, differentiation or distribution of these cell types in the spleen. Values are expressed as mean ± SEM.
Analysis of T cell subpopulation in spleen
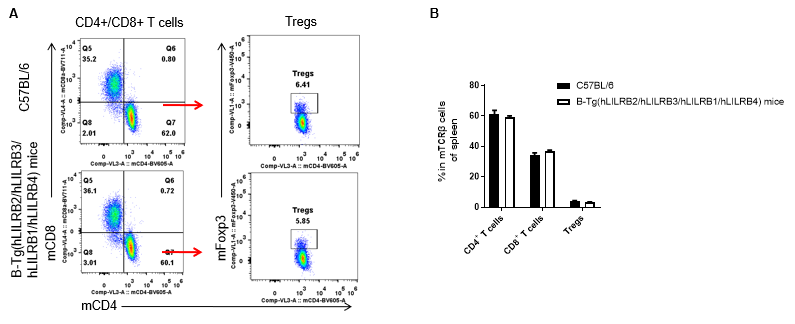
Analysis of the spleen T cell subpopulations by FACS. Splenocytes were isolated from female C57BL/6 and B-Tg(hLILRB2/hLILRB3/hLILRB1/hLILRB4) mice (n=3, 8-week-old). Flow cytometry analysis of the splenocytes was performed to assess leukocyte subpopulations. (A) Representative FACS plots. Single live CD45+ cells were gated for TCRβ+ T cell population and used for further analysis as indicated. (B) Results of FACS analysis. The percentages of CD4+ T cells, CD8+ T cells, and Tregs in B-Tg(hLILRB2/hLILRB3/hLILRB1/hLILRB4) mice were similar to those in the C57BL/6 mice, demonstrating that introduction of LILRB1, LILRB2, LILRB3, and LILRB4 does not change the overall development, differentiation or distribution of these T cell subtypes in the spleen. Values are expressed as mean ± SEM.
Analysis of leukocytes cell subpopulation in LNs
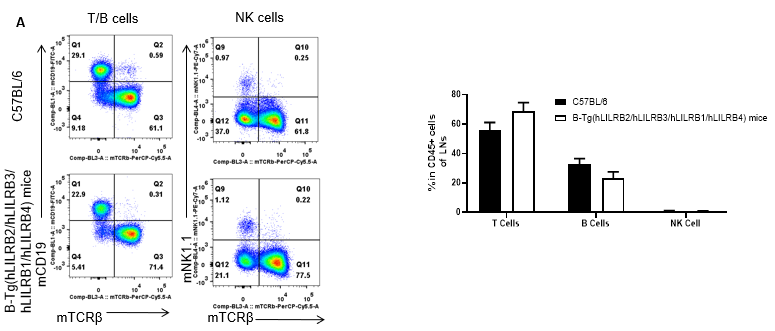
Analysis of the thymus leukocyte subpopulations by FACS. LNs (Lymph nodes) were isolated from female C57BL/6 and B-Tg(hLILRB2/hLILRB3/hLILRB1/hLILRB4) mice (n=3, 8-week-old). Flow cytometry analysis of the LNs was performed to assess leukocyte subpopulations. (A) Representative FACS plots. Single live cells were gated for the CD45+ population and used for further analysis as indicated. (B) Results of FACS analysis. The percentages of T cells, B cells, and NK cells in B-Tg(hLILRB2/hLILRB3/hLILRB1/hLILRB4)mice were similar to those in the C57BL/6 mice, demonstrating that LILRB1, LILRB2, LILRB3, and LILRB4 humanized does not change the overall development, differentiation or distribution of these cell types in the LNs. Values are expressed as mean ± SEM.
Analysis of T cell subpopulation in LNs
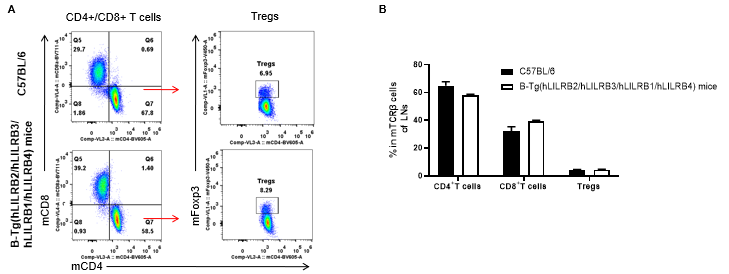
Analysis of the thymus T cell subpopulations by FACS. LNs (Lymph nodes) were isolated from female C57BL/6 and B-Tg(hLILRB2/hLILRB3/hLILRB1/hLILRB4) mice (n=3, 8-week-old). Flow cytometry analysis of the LNs was performed to assess leukocyte subpopulations. (A) Representative FACS plots. Single live CD45+ cells were gated for TCRβ+ T cell population and used for further analysis as indicated. (B) Results of FACS analysis. The percent of CD4+ T cells, CD8+ T cells, and Tregs in B-Tg(hLILRB2/hLILRB3/hLILRB1/hLILRB4) mice were similar to those in the C57BL/6 mice, demonstrating that introduction of LILRB1, LILRB2, LILRB3, and LILRB4 does not change the overall development, differentiation or distribution of these T cell subtypes in the LNs. Values are expressed as mean ± SEM.
Analysis of leukocytes cell subpopulation in blood
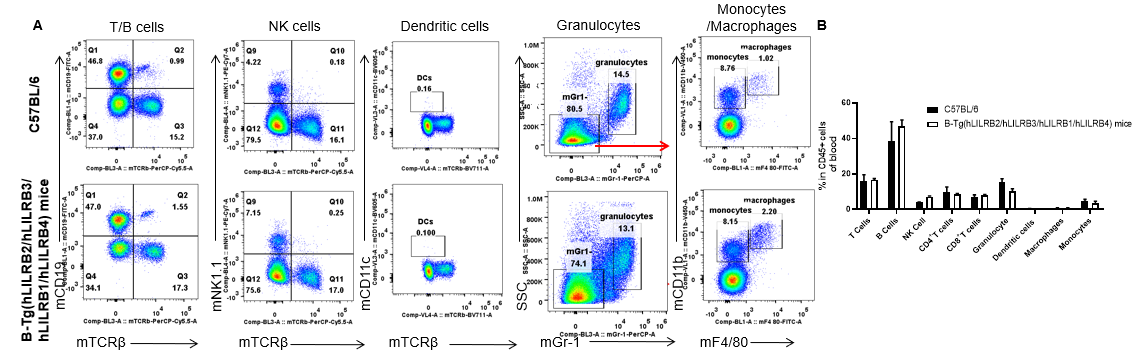
Analysis of the blood leukocyte subpopulations by FACS. Blood leukocytes were isolated from female C57BL/6 and B-Tg(hLILRB2/hLILRB3/hLILRB1/hLILRB4) mice (n=3, 8-week-old). Flow cytometry analysis of the blood leukocytes were performed to assess leukocyte subpopulations. (A) Representative FACS plots. Single live cells were gated for the CD45+ population and used for further analysis as indicated here. (B) Results of FACS analysis. The percentages of T cells, B cells, NK cells, dendritic cells, granulocytes, monocytes, and macrophages in B-Tg(hLILRB2/hLILRB3/hLILRB1/hLILRB4) mice were similar to those in the C57BL/6 mice, demonstrating that LILRB1, LILRB2, LILRB3, and LILRB4 humanized does not change the overall development, differentiation or distribution of these cell types in the blood. Values are expressed as mean ± SEM.
Analysis of T cell subpopulation in blood
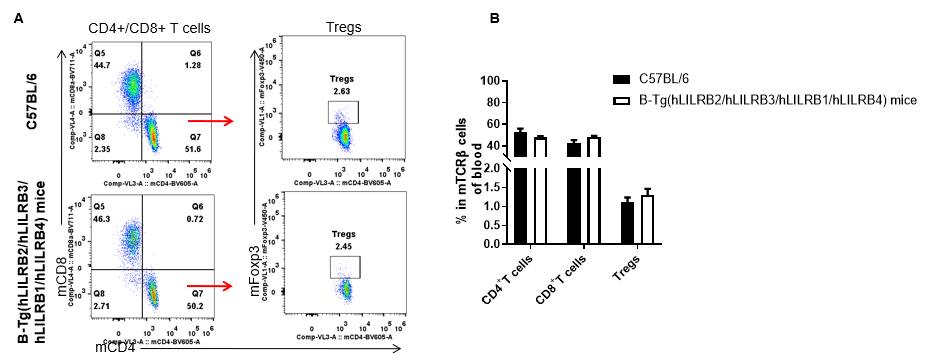
Analysis of the blood T cell subpopulations by FACS. Blood leukocytes were isolated from female C57BL/6 and B-Tg(hLILRB2/hLILRB3/hLILRB1/hLILRB4) mice (n=3, 8-week-old). Flow cytometry analysis of the blood leukocytes were performed to assess leukocyte subpopulations. (A) Representative FACS plots. Single live CD45+ cells were gated for TCRβ+ T cell population and used for further analysis as indicated here. (B) Results of FACS analysis. The percentages of CD4+ T cells, CD8+ T cells, and Tregs in B-Tg(hLILRB2/hLILRB3/hLILRB1/hLILRB4) mice were similar to those in the C57BL/6 mice, demonstrating that introduction of LILRB1, LILRB2, LILRB3, and LILRB4 does not change the overall development, differentiation or distribution of these T cell subtypes in the blood. Values are expressed as mean ± SEM.
Analysis of leukocytes cell subpopulation in BM
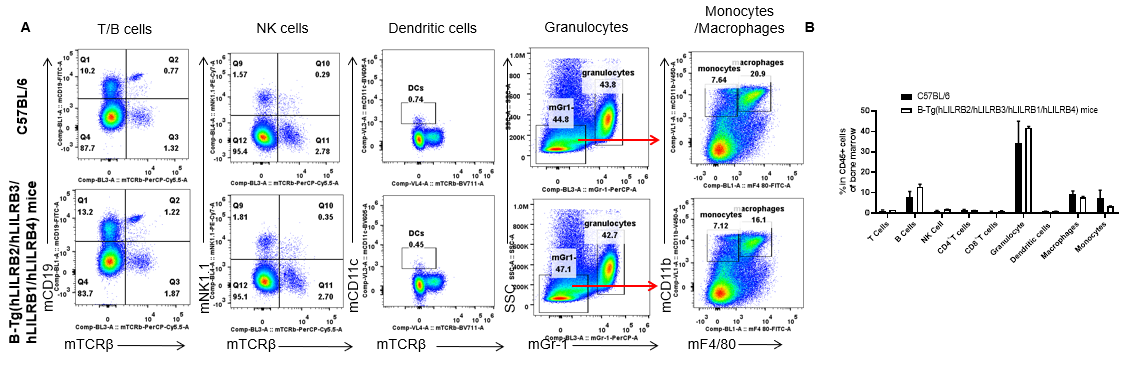
Analysis of the bone marrow leukocyte subpopulations by FACS. Bone marrow leukocytes were isolated from female C57BL/6 and B-Tg(hLILRB2/hLILRB3/hLILRB1/hLILRB4) mice (n=3, 8-week-old). Flow cytometry analysis of the bone marrow leukocyte was performed to assess leukocyte subpopulations. (A) Representative FACS plots. Single live cells were gated for the CD45+ population and used for further analysis as indicated. (B) Results of FACS analysis. The percentages of T cells, B cells, NK cells, dendritic cells, granulocytes, monocytes, and macrophages in B-Tg(hLILRB2/hLILRB3/hLILRB1/hLILRB4) mice were similar to those in the C57BL/6 mice, demonstrating that LILRB1, LILRB2, LILRB3, and LILRB4 humanized does not change the overall development, differentiation or distribution of these cell types in the bone marrow. Values are expressed as mean ± SEM.
Analysis of T cell subpopulation in BM
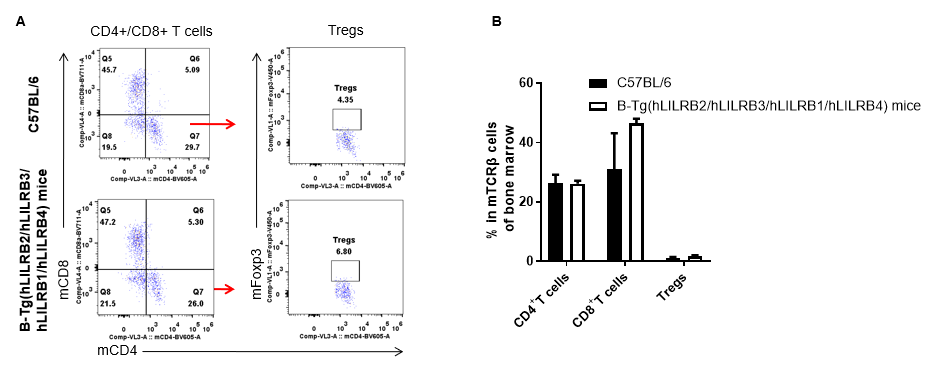
Analysis of the bone marrow T cell subpopulations by FACS. Bone marrow leukocytes were isolated from female C57BL/6 and B-Tg(hLILRB2/hLILRB3/hLILRB1/hLILRB4) mice (n=3, 8-week-old). Flow cytometry analysis of the bone marrow leukocyte was performed to assess leukocyte subpopulations. (A) Representative FACS plots. Single live CD45+ cells were gated for TCRβ+ T cell population and used for further analysis as indicated. (B) Results of FACS analysis. The percentages of CD4+ T cells, CD8+ T cells, and Tregs in B-Tg(hLILRB2/hLILRB3/hLILRB1/hLILRB4) mice were similar to those in the C57BL/6 mice, demonstrating that introduction of LILRB1, LILRB2, LILRB3, and LILRB4 does not change the overall development, differentiation or distribution of these T cell subtypes in the bone marrow. Values are expressed as mean ± SEM.
hLILRB1 expression in CD45+ cells
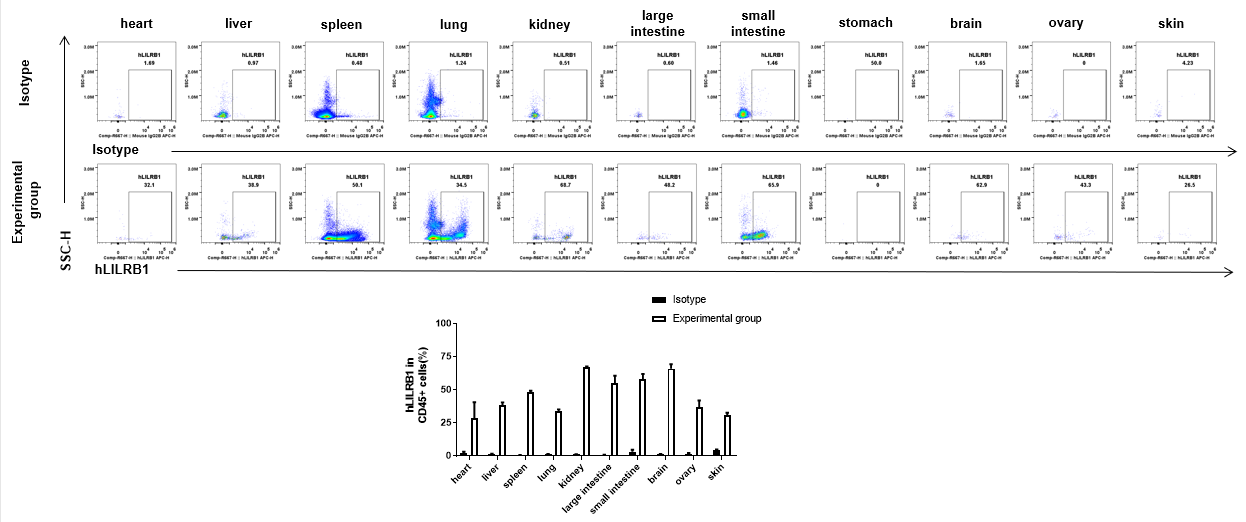
Strain specific hLILRB1 expression analysis in B-Tg(hLILRB1/hLILRB2/hLILRB3/hLILRB4) mice by flow cytometry. Heart, liver, spleen, lung, kidney, large intestine, small intestine, stomach, brain, ovary, and skin were collected from B-Tg(hLILRB1/hLILRB2/hLILRB3/hLILRB4) mice, analyzed by flow cytometry with anti-hLILRB1 antibody.
hLILRB2 expression in CD45+ cells
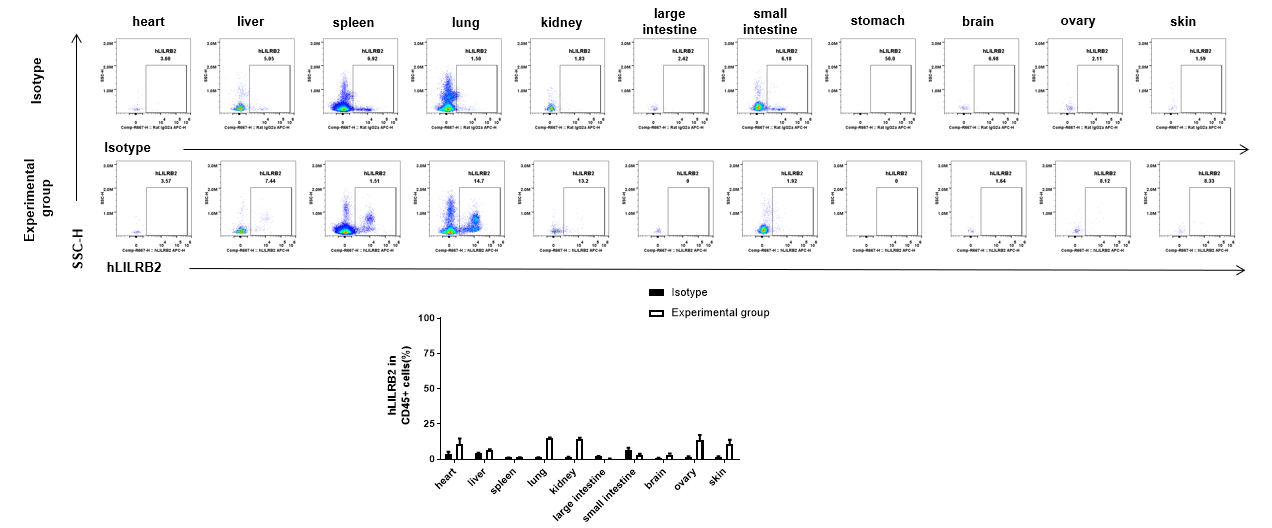
Strain specific hLILRB2 expression analysis in B-Tg(hLILRB1/hLILRB2/hLILRB3/hLILRB4) mice by flow cytometry. Heart, liver, spleen, lung, kidney, large intestine, small intestine, stomach, brain, ovary, and skin were collected from B-Tg(hLILRB1/hLILRB2/hLILRB3/hLILRB4) mice, analyzed by flow cytometry with anti-hLILRB2 antibody.
hLILRB3 expression in CD45+ cells
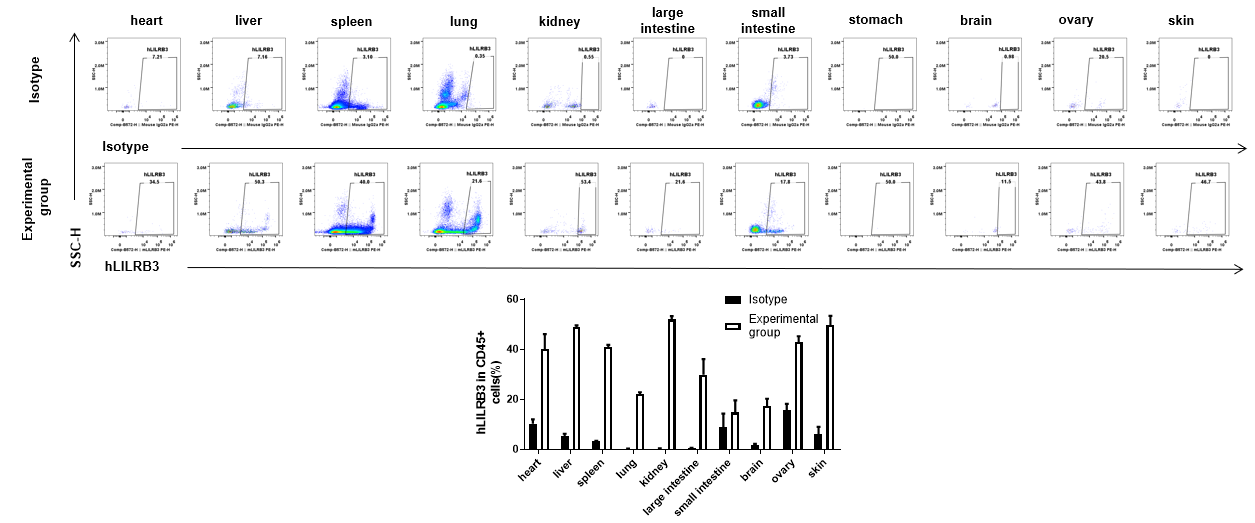
Strain specific hLILRB3 expression analysis in B-Tg(hLILRB1/hLILRB2/hLILRB3/hLILRB4) mice by flow cytometry. Heart, liver, spleen, lung, kidney, large intestine, small intestine, stomach, brain, ovary, and skin were collected from B-Tg(hLILRB1/hLILRB2/hLILRB3/hLILRB4) mice, analyzed by flow cytometry with anti-hLILRB3 antibody.
hLILRB4 expression in CD45+ cells
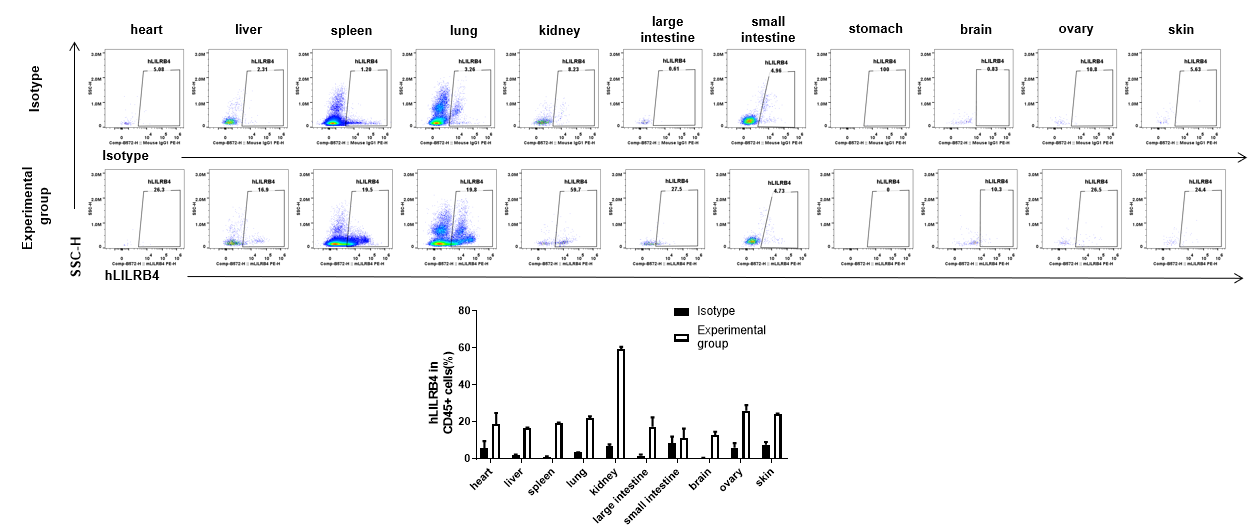
Strain specific hLILRB4 expression analysis in B-Tg(hLILRB1/hLILRB2/hLILRB3/hLILRB4) mice by flow cytometry. Heart, liver, spleen, lung, kidney, large intestine, small intestine, stomach, brain, ovary, and skin were collected from B-Tg(hLILRB1/hLILRB2/hLILRB3/hLILRB4) mice, analyzed by flow cytometry with anti-hLILRB4 antibody.
Protein expression in T cells of bone marrow
Strain specific hLILRB1/4 expression analysis in B-Tg(hLILRB1/hLILRB2/hLILRB3/hLILRB4) mice by flow cytometry. Bone marrow cells were collected from wild-type mice and B-Tg(hLILRB1/hLILRB2/hLILRB3/hLILRB4) mice, analyzed by flow cytometry with anti-LILRB1 antibody or anti-LILRB4 antibody.
