

NOD.CB17-Prkdcscid Il2rgtm1Bcgen Flt3tm1Bcgen/Bcgen • 112869
| Product name | B-NDG Flt3 KO mice |
|---|---|
| Catalog number | 112869 |
| Strain name | NOD.CB17-Prkdcscid Il2rgtm1Bcgen Flt3tm1Bcgen/Bcgen |
| Strain background | B-NDG |
| NCBI gene ID | 2322 |
| Aliases | FLK2, STK1, CD135, FLK-2 |
| Application | This product results in a high level of immune system reconstitution after the transplantation of hematopoietic stem cells, especially for DC cells. |
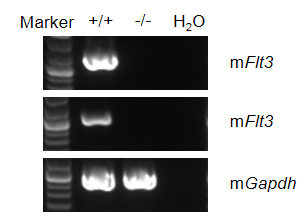
Strain specific analysis of Flt3 mRNA expression in B-NDG mice and homozygous B-NDG Flt3 KO mice by RT-PCR. Bone marrow RNA were isolated from B-NDG mice and homozygous B-NDG Flt3 KO mice (-/-), then cDNA libraries were synthesized by reverse transcription, followed by PCR with mouse Flt3 primers. Mouse Flt3 mRNA was detectable only in B-NDG mice but not in homozygous B-NDG Flt3 KO mice.
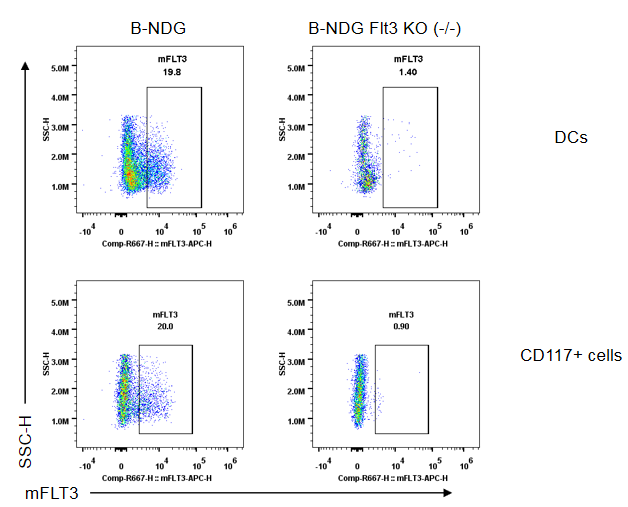
Strain specific KIT expression analysis in B-NDG mice by flow cytometry. Bone marrow was collected from B-NDG mice and B-NDG Flt3 KO mice (-/-). Protein expression was analyzed with species-specific anti-mouse FLT3 antibody. mFLT3 was detectable in DCs and CD117+ cells of B-NDG mice, but not in homozygous B-NDG Flt3 KO mice.
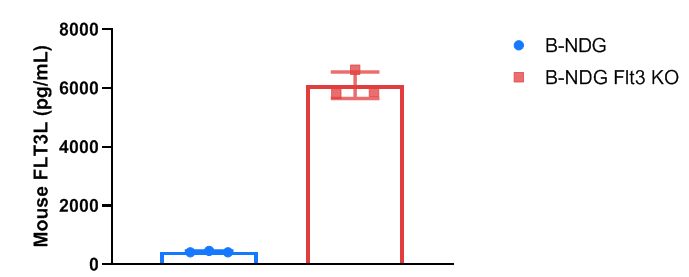
Strain specific mFLT3L expression analysis in homozygous B-NDG Flt3 KO mice by ELISA. Serum were isolated from B-NDG mice (n=3, 8-week-old) and homozygous B-NDG Flt3 KO mice (-/-) (n=3, 8-week-old). Expression level of mouse FLT3L were analyzed by ELISA. Mouse FLT3L was detectable in B-NDG mice and homozygous B-NDG Flt3 KO mice. Values are expressed as mean ± SEM.
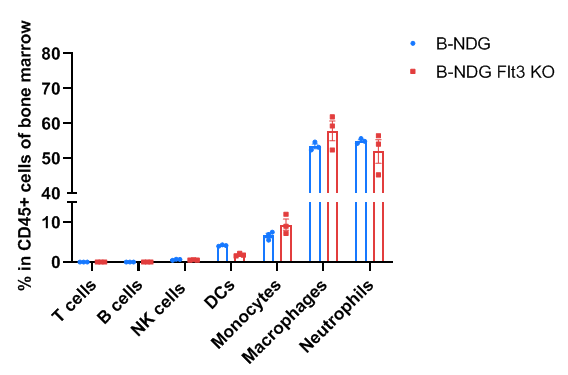
Frequency of leukocyte subpopulations in bone marrow by flow cytometry. Bone marrow cells were isolated from B-NDG mice and homozygous B-NDG Flt3 KO mice (male, 8-week-old, n=3). Flow cytometry analysis of the bone marrow cells was performed to assess the frequency of leukocyte subpopulations. Frequencies of T cells, B cells, NK cells, granulocytes, monocytes, macrophages in B-NDG Flt3 KO mice were similar to those in B-NDG mice. Frequencies of DCs in B-NDG Flt3 KO mice were lower than those in B-NDG mice. Values are expressed as mean ± SEM. Significance was determined by two-way ANOVA test. *P < 0.05, **P < 0.01, ***P < 0.001.
