ALS Mouse Model Introduction
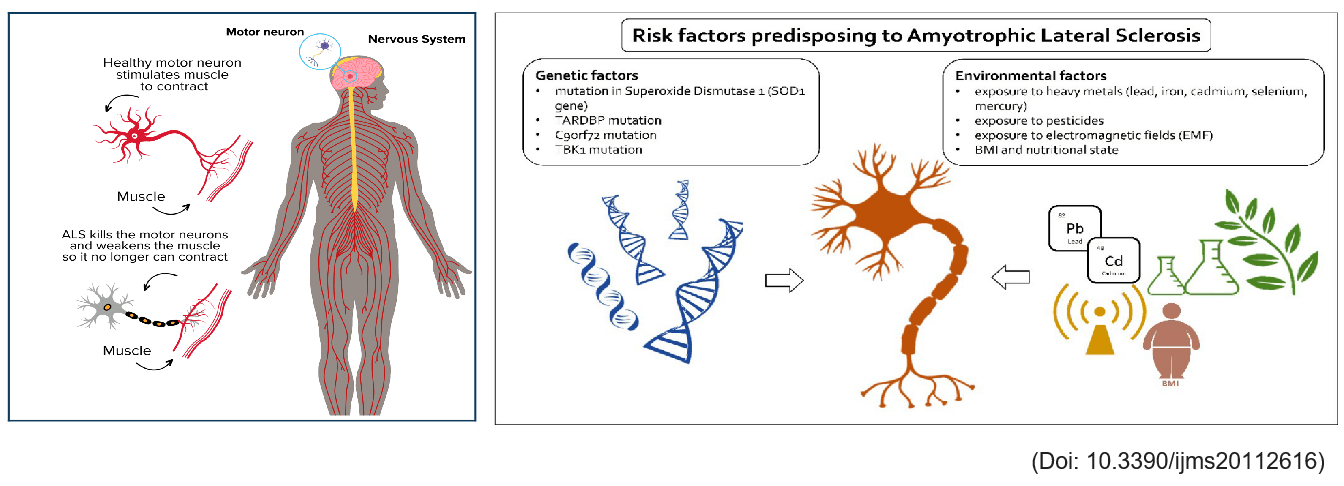
Amyotrophic lateral sclerosis (ALS), commonly known as “Lou Gehrig’s disease,” is a fatal neurodegenerative disorder characterized by the progressive degeneration and death of upper and lower motor neurons (MNs) in the central nervous system, which are responsible for controlling muscle movement and respiration. This leads to gradual muscle weakness and atrophy. Most ALS patients die within three to five years after the onset of symptoms due to respiratory failure. Approximately two-thirds of familial ALS cases and about 10% of sporadic ALS cases are associated with genetic mutations, including those in the SOD1, TARDBP, ALS2, C9ORF72, and FUS genes.
Summary of ALS models in Biocytogen
| Model type |
Model names |
Modeling reagent |
Core Index |
Optional tests |
| Amyotrophic lateral sclerosis (ALS) |
B-Tg(Thy1-hTARDBP*A315T) mice |
- |
Clasping test
Grip strength test
Rotarod test
Gait analysis |
Inflammation analysis |
Results
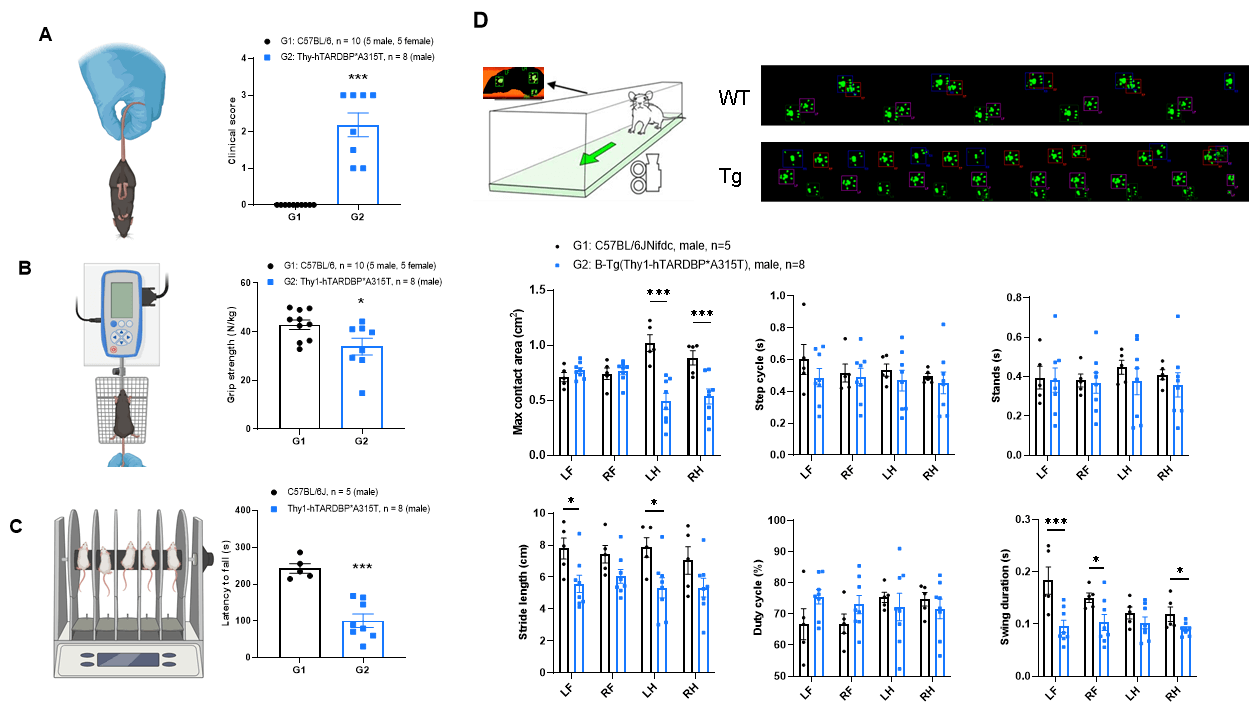
Motor function assessment in B-Tg(Thy1-hTARDBP*A315T) mice (V2)
Motor function assessment in wild-type C57BL/6JNifdc (4-months-old) and B-Tg (Thy1-hTARDBP*A315T) mice (4-months-old). A, Clasping test reveals significant motor dysfunction in transgenic mice, as evidenced by abnormal hindlimb retraction. B, Grip strength test shows reduced muscle strength in transgenic mice compared to wild-type C57BL/6J mice. C, The rotarod performance indicates impaired motor coordination in transgenic mice. D-G, Gait analysis demonstrates abnormal locomotor function in transgenic mice. D, The transgenic B-Tg(Thy1-hTARDBP*A315T) mice exhibit significant different gait characteristics across multiple gait parameters, indicating that the locomotor ability and coordination of the transgenic mice are abnormal. Values are expressed as mean ± SEM. *P < 0.05, **P < 0.01, ***P < 0.001.