
on this page
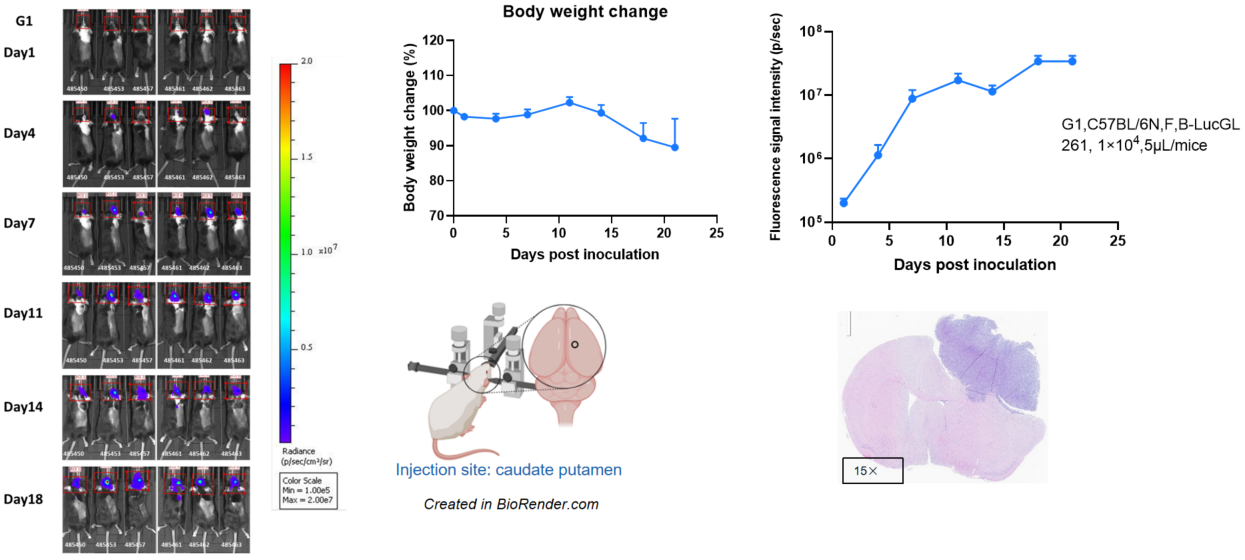
Establishment of orthotopic glioma model.
The mouse orthotopic glioma model was generated by implanting B-Luc GL261 cells in the caudate putamen of B-NDG mice (F, n=6), and the body weight and tumor volume of the mice were recorded weekly. This results indicated that the cell line was successfully constructed as an orthotopic tumor model. H&E staining showed that tumor was seen in brain.
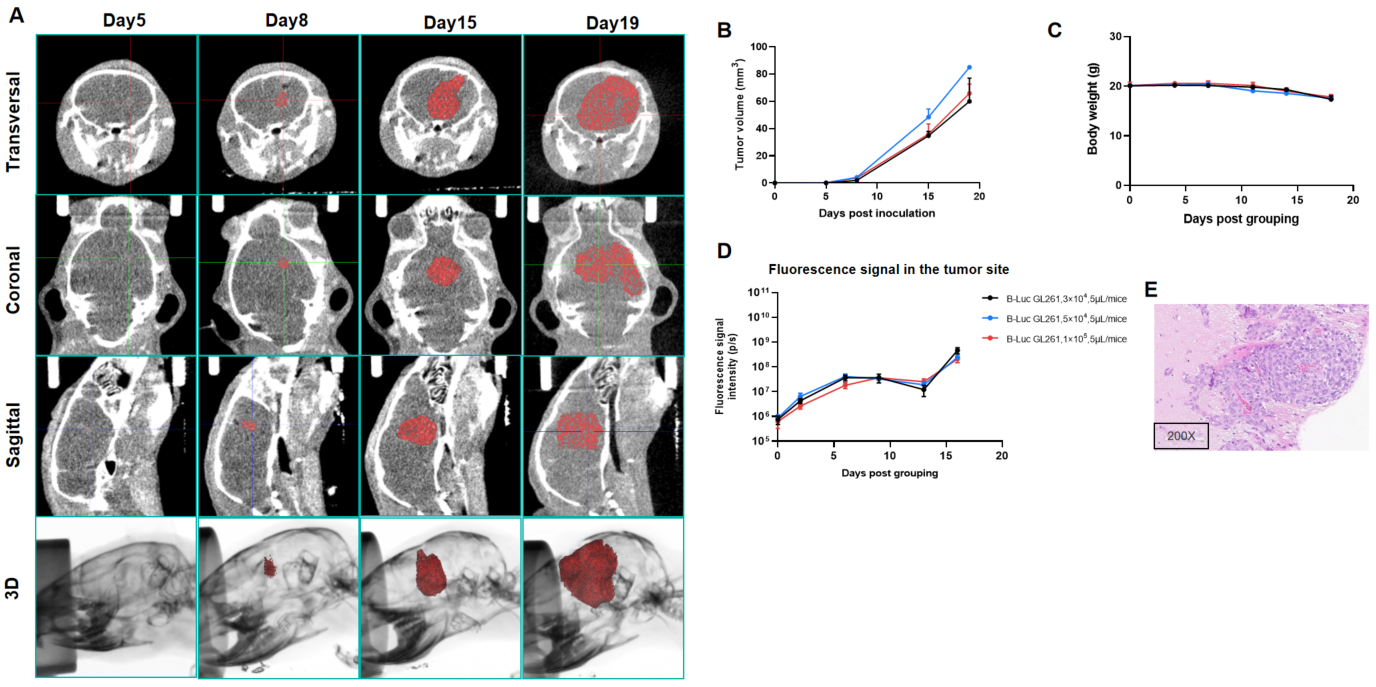
A: Micro-CT images of B-Luc GL261 orthotopic model in C57BL/6 mice were scanned 5 days after inoculation. The image shows the cross-sectional, coronal, and sagittal planes of the mouse head, with red representing the actual tumor and more realistically displaying the growth trend and size of orthotopic glioblastoma model in the 3D image. B: Tumor volume measured by contrast-enhanced CBCT. C: Body weight change. D: Dynamic changes of total fluorescence signal in the tumor site after inoculation. E: H&E staining of mouse brain inoculated with B-Luc GL261 cells.
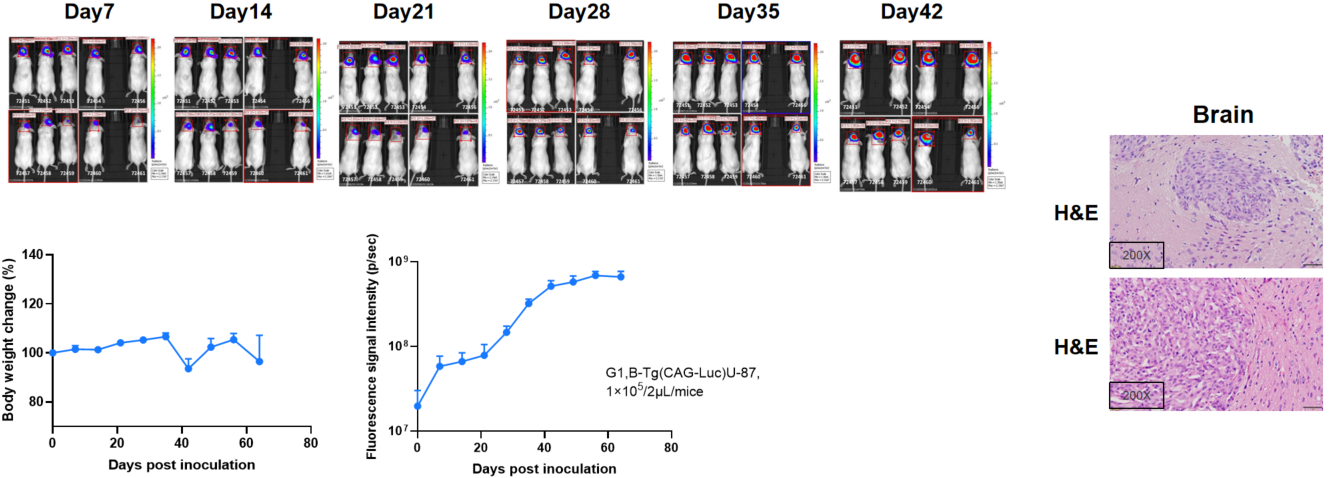
Establishment of orthotopic Glioma model.
The mouse orthotopic Glioma was generated by implanting B-Tg(Luc-EGFP) U-87 MG cells in the caudate putamen of B-NDG mice (F, n=10), and the body weight and tumor volume of the mice were recorded weekly. The results showed that the tumor volume increased and body weight of mice slightly change during this study. This indicates that the cell line was successfully constructed as an orthotopic tumor model.
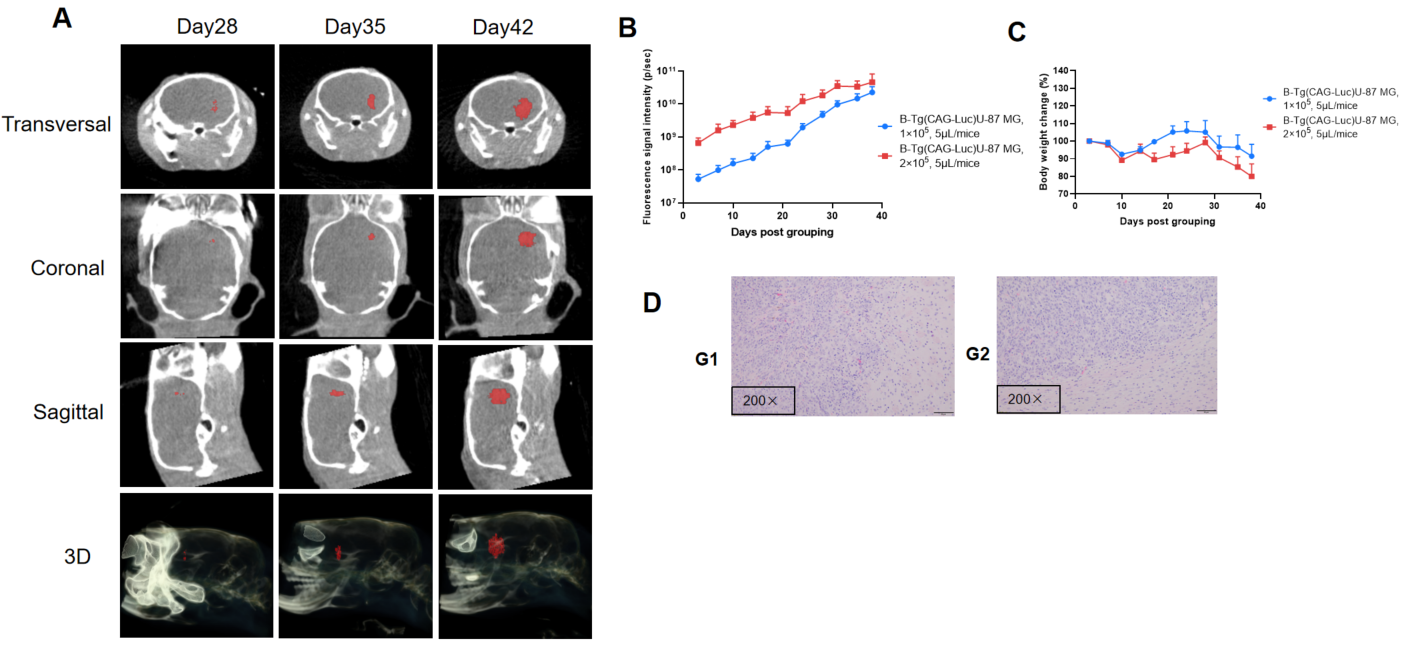
A: Micro-CT images of B-Tg(Luc-EGFP) U-87 MG orthotopic model in B-NDG mice (F, n=6) were scanned 5 days after inoculation. The image shows the cross-sectional, coronal, and sagittal planes of the mouse head, with red representing the actual tumor and more realistically displaying the growth trend and size of orthotopic glioblastoma model in the 3D image. B: Dynamic changes of total fluorescence signal in the tumor site after inoculation. C: Body weight change. D. H&E staining.
