C57BL/6-Prrx1tm1(icre)Bcgen/Bcgen • 110130
| Product name | B-Prrx1-iCre mice |
|---|---|
| Catalog number | 110130 |
| Strain name | C57BL/6-Prrx1tm1(icre)Bcgen/Bcgen |
| Strain background | C57BL/6 |
| NCBI gene ID | 18933 (Mouse) |
| Official symbol | Prrx1(paired relatedhomeobox 1), K-2; Pmx; mHox |
| Chromosome | 1 |
| Application | Function researchof genes This Prrx1iCre model is anefficient tool to study various gene functions when crossed with mice withdifferent loxP site-flanked genes of interest, especially in studies ofmesodermal development, such as cardiac, skeletal development and signaling. |
Expressed gene
iCre, improved crerecombinase, bacteriophage P1
Site of expression
The mesoderm of mouseembryos, cardiac, skeletal, and smooth muscle tissues in adults.
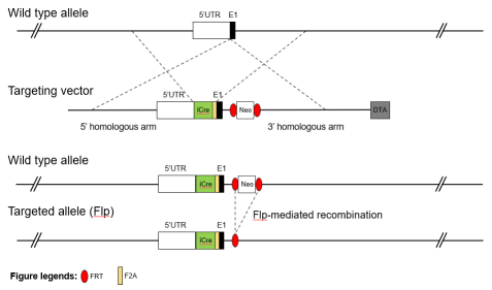
An F2A-iCre sequence cassette was placed between the coding sequence of exon 1 and 5'UTR of the Prrx1 gene in C57BL/6 ES cells. This strain was maintained on a C57BL/6 genetic background.
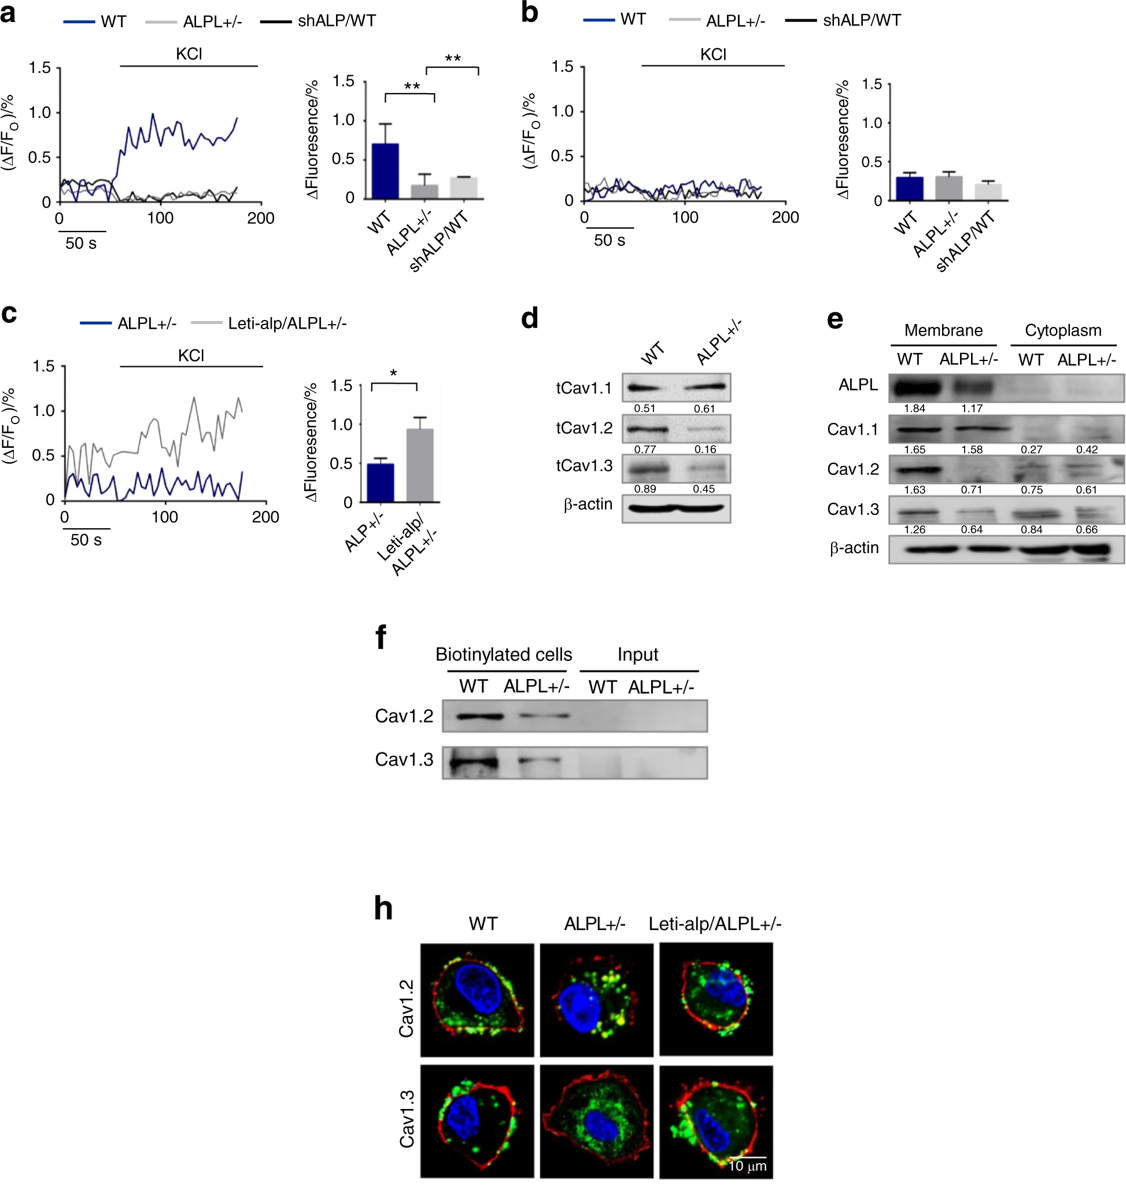
ALPL deficiency caused decreased membrane expression of L-type Ca2+ channels in BMSCs. a Ca2+ imaging showed decreased Ca2+ influx in cultured alpl+/− BMSCs and WT BMSCs transfected with shALP (shALP/WT) after they were stimulated with 30 mmol·L−1 KCl for 3 min (n = 10). b No KCl-induced Ca2+ influx was detected in cultured WT, alpl+/−, and shALP/WT BMSCs treated with 10 mmol·L−1 EGTA for 3 min (n = 10). c ALPL overexpression was mediated by a lentivirus in alpl+/− (Lenti-alp/alpl+/−) BMSCs and resulted in an elevated Ca2+ influx following stimulation with 30 mmol·L−1 KCl for 3 min (n = 10). d, e The expression of CaV1.1, CaV1.2, and CaV1.3 was assessed. alpl+/− BMSCs showed decreases in total cell expression (d) and membrane expression of CaV1.2 and CaV1.3 (e) and no significant change in the levels ofcytoplasmic CaV1.2 and CaV1.3 (e). Total CaV1.1 protein expression was not changed (d), and the expression of membrane and cytoplasmic CaV1.1 was not altered in alpl+/− BMSCs (e). f Cell-surface biotinylation assay. Left two lanes: western blot for CaV1.2 and CaV1.3 followingneutravidin pull down from WT and alpl+/− BMSCs; right two lanes: input, not biotinylated cells. h, Representative images of confocal laser scanning microscopy showing the membrane location of CaV1.2 and CaV1.3 (green) in WT and Lenti-alp/alpl+/− BMSCs. The plasma membrane was stained with the marker CellMask™ Deep Red Plasma Membrane Stain (red) (h). Scale bar, 10 μm. (source: Li B et al.,2020)