
C57BL/6-Fcgr4tm2(FCGR3A)Bcgen/Bcgen • 111173
| Product name | B-hCD16A mice |
|---|---|
| Catalog number | 111173 |
| Strain name | C57BL/6-Fcgr4tm2(FCGR3A)Bcgen/Bcgen |
| Strain background | C57BL/6N |
| NCBI gene ID | 246256 (Human) |
| Aliases | FCGR3A (Fc fragment of IgG receptor IIIa), CD16A |
Gene targeting strategy for B-hCD16A mice. The regulatory region and exons 1~5 of mouse Fcgr4 gene that encode the full-length protein were replaced by human FCGR3A(F158V) exons 1~6 and regulatory region in B-hCD16A mice.
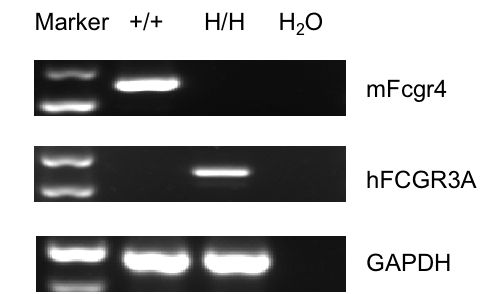
Strain specific analysis of CD16A gene expression in wild-type mice and homozygous B-hCD16A mice by RT-PCR.
Mouse Fcgr4 mRNA was exclusively detectable in wild-type mice and human FCGR3A mRNA was exclusively detectable in homozygous B-hCD16A mice (H/H).
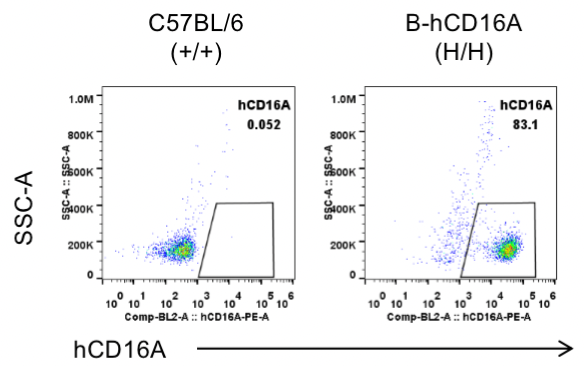
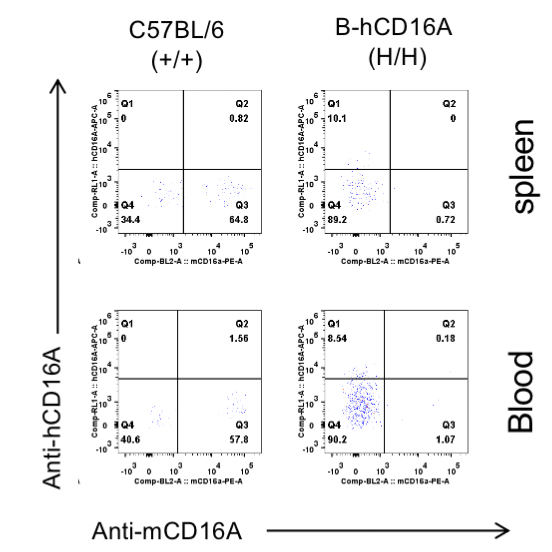
Strain specific CD16A expression analysis in wild-type C57BL/6 mice and homozygous B-hCD16A mice by flow cytometry.
Splenocytes were collected from wild-type C57BL/6 mice(+/+) and homozygous B-hCD16A mice (H/H). Human CD16A was exclusively detectable in the NK cells of homozygous B-hCD16A mice.
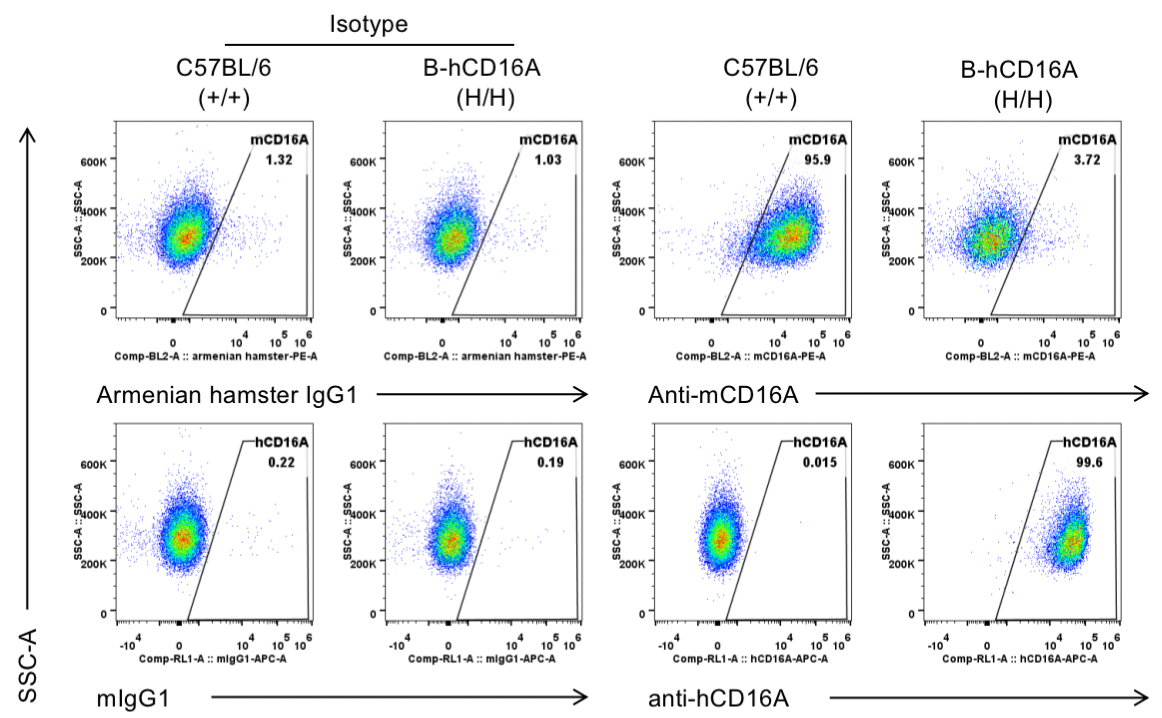
Strain specific CD16A expression analysis in wild-type C57BL/6 mice and homozygous B-hCD16A mice by flow cytometry. Peritoneal exudative macrophages(PEMs) were collected from wild-type C57BL/6 mice(+/+) and homozygous B-hCD16A mice(H/H). Mouse CD16A was exclusively detectable in wild-type C57BL/6 mice. Human CD16A was exclusively detectable in homozygous B-hCD16A mice.
NK cells
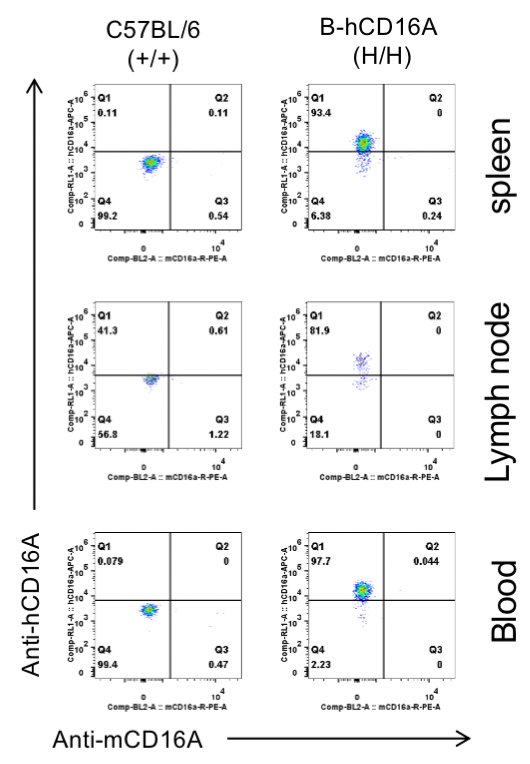
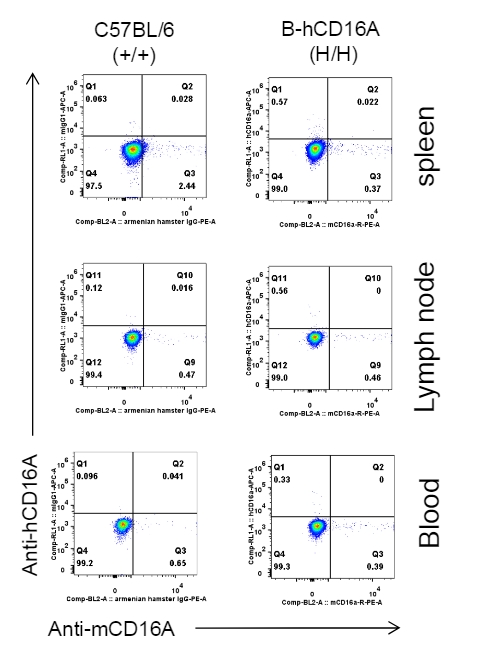
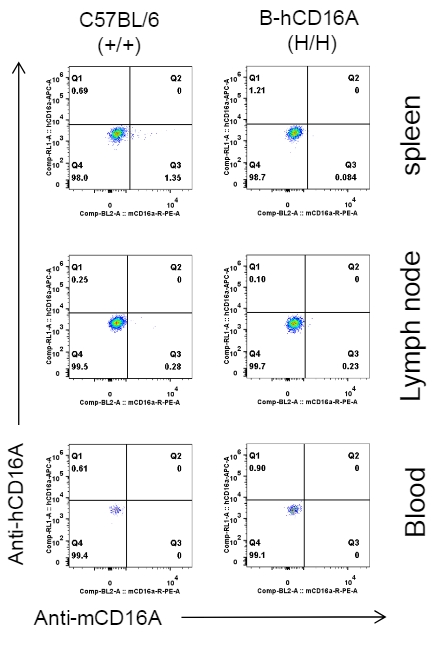
Strain specific CD16A expression analysis in wild-type C57BL/6 mice and homozygous B-hCD16A mice by flow cytometry.
Different tissues were collected from wild-type C57BL/6 mice(+/+) and homozygous B-hCD16A mice (H/H). Human CD16A was exclusively detectable in the NK cells of homozygous B-hCD16A mice.
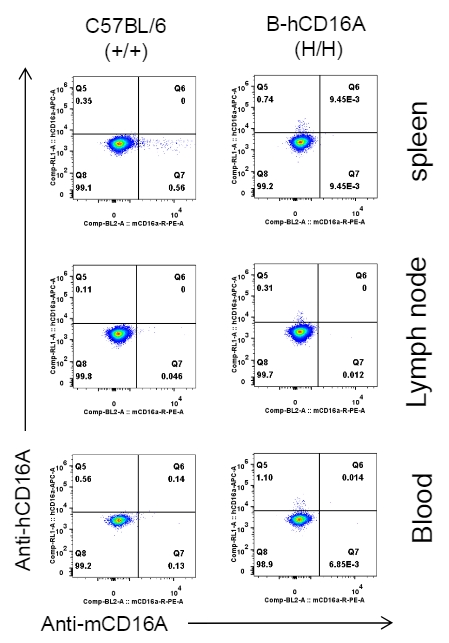
B cells
Strain specific CD16A expression analysis in wild-type C57BL/6 mice and homozygous B-hCD16A mice by flow cytometry.
Different tissues were collected from wild-type C57BL/6 mice(+/+) and homozygous B-hCD16A mice (H/H). Mouse CD16A and human CD16A was not detectable in B cells of wild-type C57BL/6 mice or homozygous B-hCD16A mice.
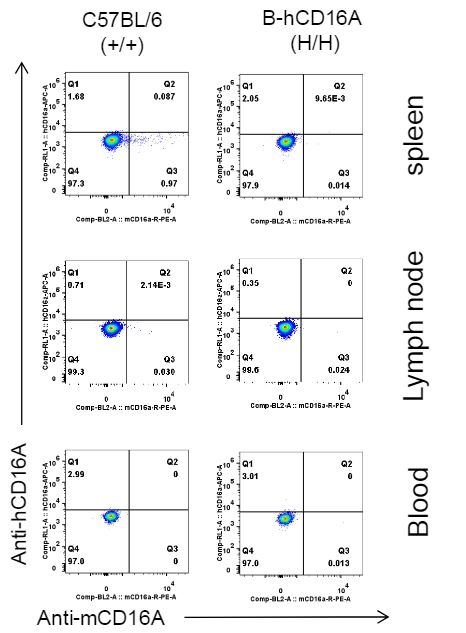
T cells
Strain specific CD16A expression analysis in wild-type C57BL/6 mice and homozygous B-hCD16A mice by flow cytometry.
Different tissues were collected from wild-type C57BL/6 mice(+/+) and homozygous B-hCD16A mice (H/H). Mouse CD16A and human CD16A was not detectable in T cells of wild-type C57BL/6 mice or homozygous B-hCD16A mice.
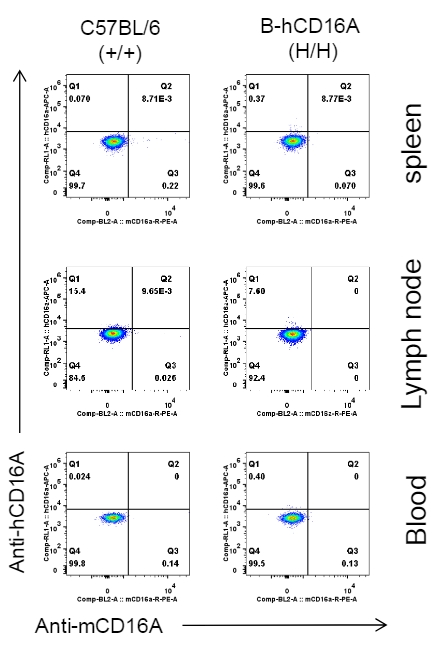
CD4+ T cells
Strain specific CD16A expression analysis in wild-type C57BL/6 mice and homozygous B-hCD16A mice by flow cytometry.
Different tissues were collected from wild-type C57BL/6 mice(+/+) and homozygous B-hCD16A mice (H/H). Mouse CD16A and human CD16A was not detectable in CD4+ T cells of wild-type C57BL/6 mice or homozygous B-hCD16A mice.
CD8+ T cells
Strain specific CD16A expression analysis in wild-type C57BL/6 mice and homozygous B-hCD16A mice by flow cytometry.
Different tissues were collected from wild-type C57BL/6 mice(+/+) and homozygous B-hCD16A mice (H/H). Mouse CD16A and human CD16A was not detectable in CD8+ T cells of wild-type C57BL/6 mice or homozygous B-hCD16A mice.
Treg cells
Strain specific CD16A expression analysis in wild-type C57BL/6 mice and homozygous B-hCD16A mice by flow cytometry.
Different tissues were collected from wild-type C57BL/6 mice(+/+) and homozygous B-hCD16A mice (H/H). Mouse CD16A and human CD16A was not detectable in Treg cells of wild-type C57BL/6 mice or homozygous B-hCD16A mice.
DCs
Strain specific CD16A expression analysis in wild-type C57BL/6 mice and homozygous B-hCD16A mice by flow cytometry.
Different tissues were collected from wild-type C57BL/6 mice(+/+) and homozygous B-hCD16A mice (H/H). Mouse CD16A was exclusively detective in DCs of wild-type mice. Human CD16A was detectable in DCs of homozygous B-hCD16A mice at a very low expression level.
Granulocytes
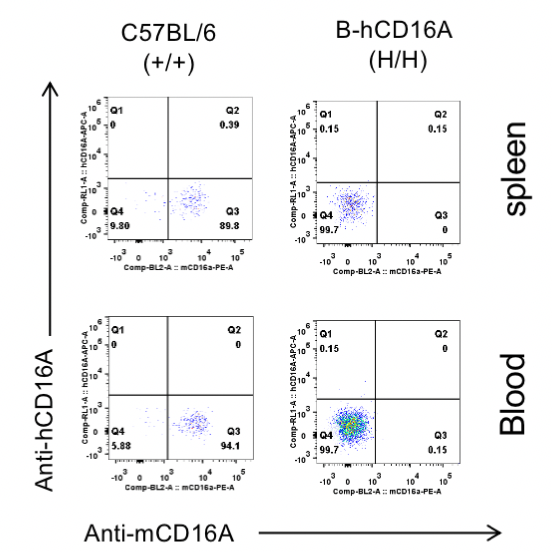
Strain specific CD16A expression analysis in wild-type C57BL/6 mice and homozygous B-hCD16A mice by flow cytometry.
Different tissues were collected from wild-type C57BL/6 mice(+/+) and homozygous B-hCD16A mice (H/H). Mouse CD16A was exclusively detective in granulocytes of wild-type mice. Human CD16A was not detectable in granulocytes of wild-type C57BL/6 mice or homozygous B-hCD16A mice.
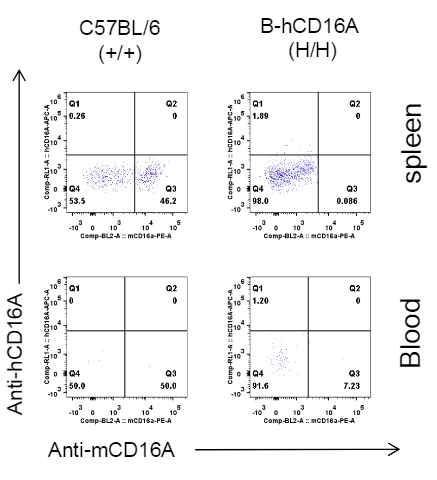
Monocytes
Strain specific CD16A expression analysis in wild-type C57BL/6 mice and homozygous B-hCD16A mice(v2) by flow cytometry. Different tissues were collected from wild-type C57BL/6 mice(+/+) and homozygous B-hCD16A mice (H/H). Mouse CD16A was not detective in monocytes of wild-type mice. Human CD16A was exclusively detectable in monocytes of homozygous B-hCD16A mice.
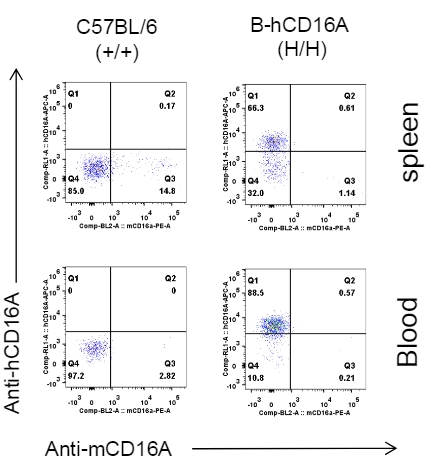
Macrophages
Strain specific CD16A expression analysis in wild-type C57BL/6 mice and homozygous B-hCD16A mice by flow cytometry. Different tissues were collected from wild-type C57BL/6 mice(+/+) and homozygous B-hCD16A mice (H/H). Mouse CD16A was exclusively detective in macrophages of wild-type mice. Human CD16A was exclusively detectable in macrophages of homozygous B-hCD16A mice .
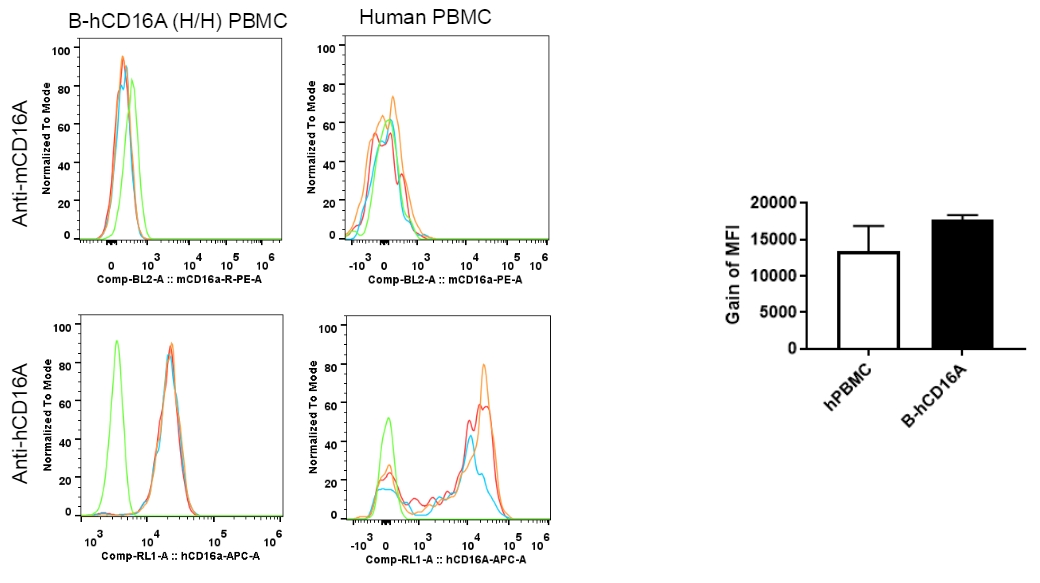
Strain specific CD16A expression level analysis in NK cells of homozygous B-hCD16A mice and human PBMCs by flow cytometry.
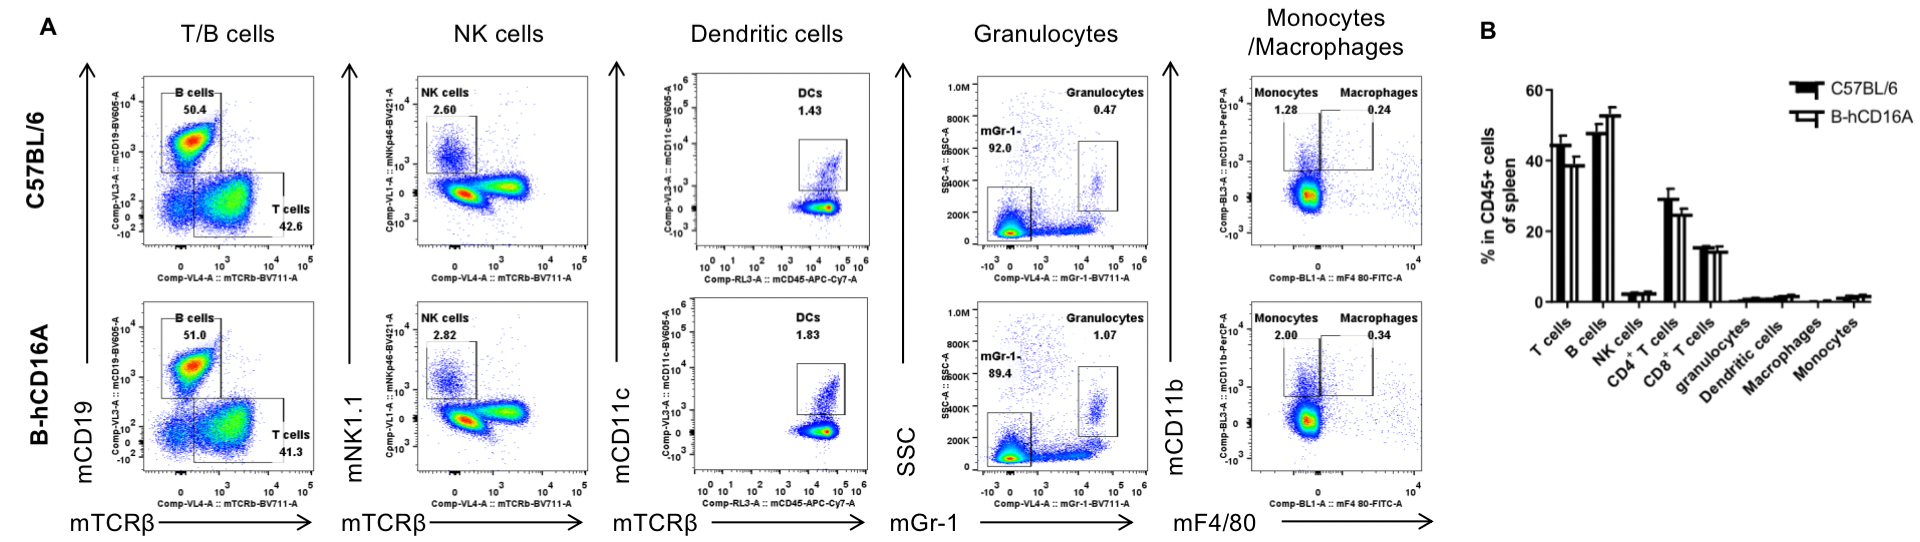
Analysis of spleen leukocyte subpopulations by FACS. Splenocytes were isolated from female C57BL/6 and B-hCD16A mice (n=3, 6-week-old). Flow cytometry analysis of the splenocytes was performed to assess leukocyte subpopulations. A. Representative FACS plots. Single live cells were gated for the CD45+ population and used for further analysis as indicated here. B. Results of FACS analysis. Values are expressed as mean ± SEM.
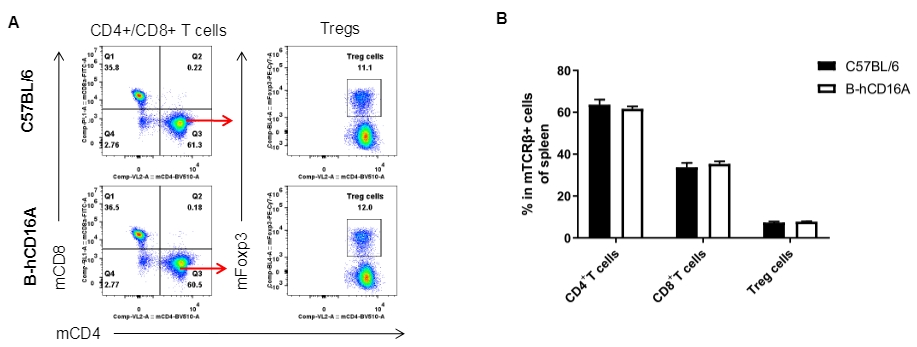
Analysis of spleen T cell subpopulations by FACS. Splenocytes were isolated from female C57BL/6 and B-hCD16A mice (n=3, 6-week-old). Flow cytometry analysis of the splenocytes was performed to assess leukocyte subpopulations. A. Representative FACS plots. Single live CD45+ cells were gated for TCRβ+T cell population and used for further analysis as indicated here. B. Results of FACS analysis. Values are expressed as mean ± SEM.
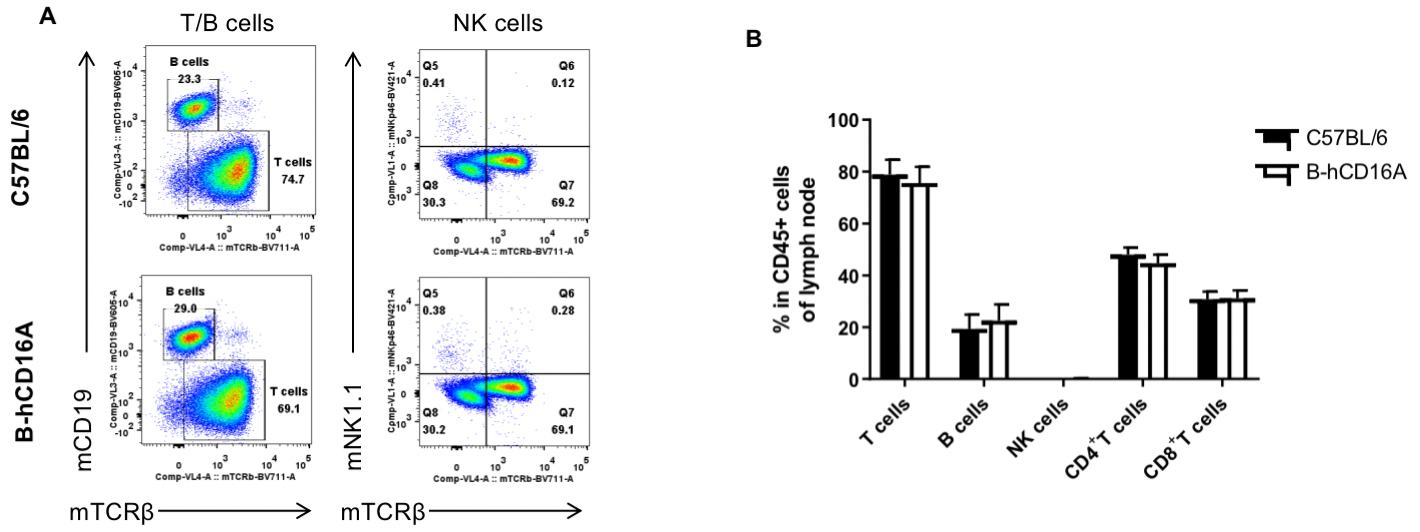
Analysis of LNs leukocyte subpopulations by FACS. LNs were isolated from female C57BL/6 and B-hCD16A mice (n=3, 6-week-old). Flow cytometry analysis of the LNs was performed to assess leukocyte subpopulations. A. Representative FACS plots. Single live cells were gated for the CD45+ population and used for further analysis as indicated here. B. Results of FACS analysis. Values are expressed as mean ± SEM.
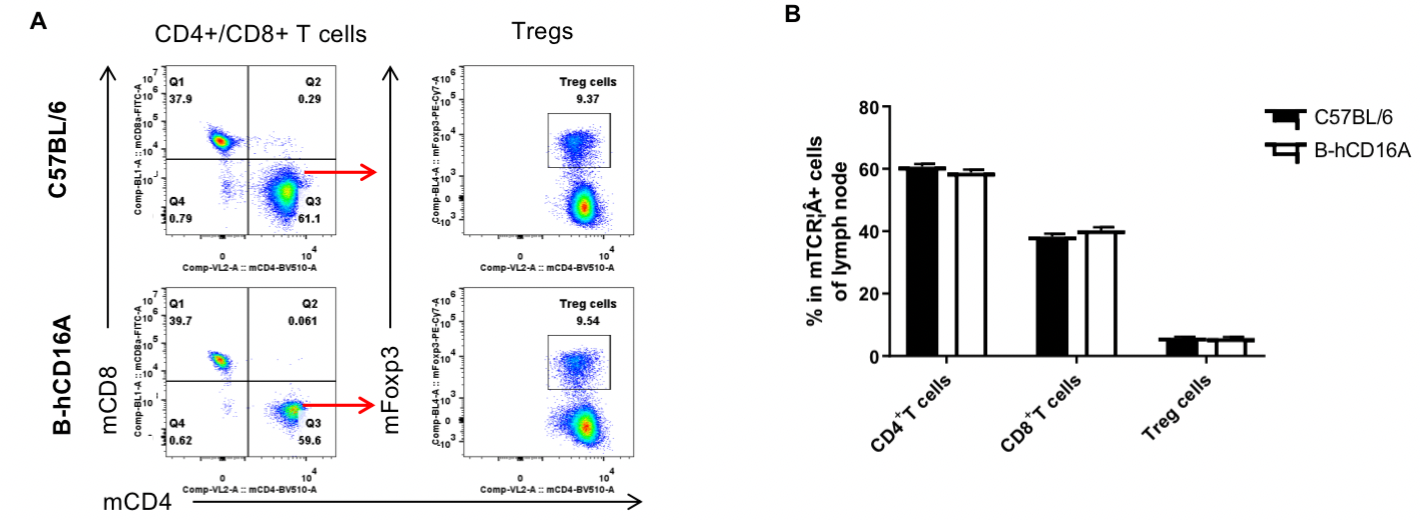
Analysis of LNs T cell subpopulations by FACS. LNs were isolated from female C57BL/6 and B-hCD16A mice (n=3, 6-week-old). Flow cytometry analysis of the LNs was performed to assess leukocyte subpopulations. A. Representative FACS plots. Single live CD45+ cells were gated for TCRβ+T cell population and used for further analysis as indicated here. B. Results of FACS analysis. Values are expressed as mean ± SEM.
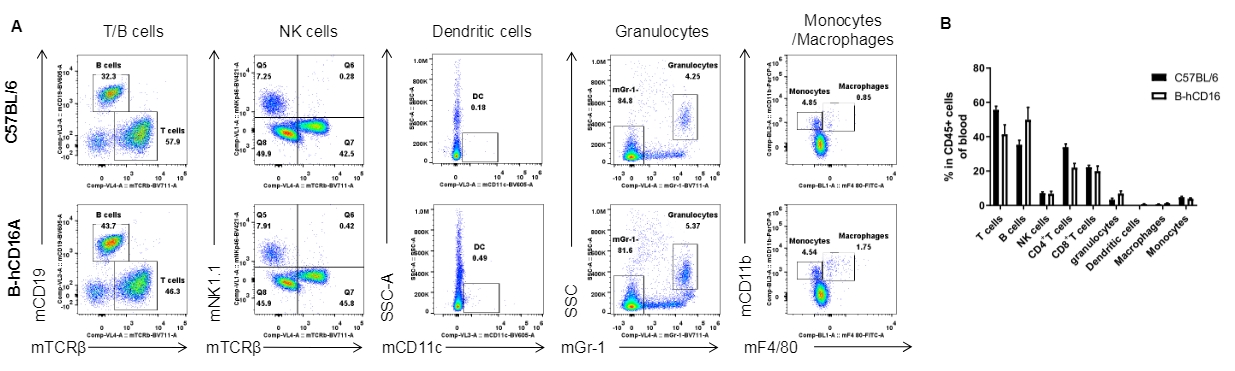
Analysis of blood leukocyte subpopulations by FACS. Blood were isolated from female C57BL/6 and B-hCD16A mice (n=3, 6-week-old). Flow cytometry analysis of the blood was performed to assess leukocyte subpopulations. A. Representative FACS plots. Single live cells were gated for the CD45+ population and used for further analysis as indicated here. B. Results of FACS analysis. Values are expressed as mean ± SEM.
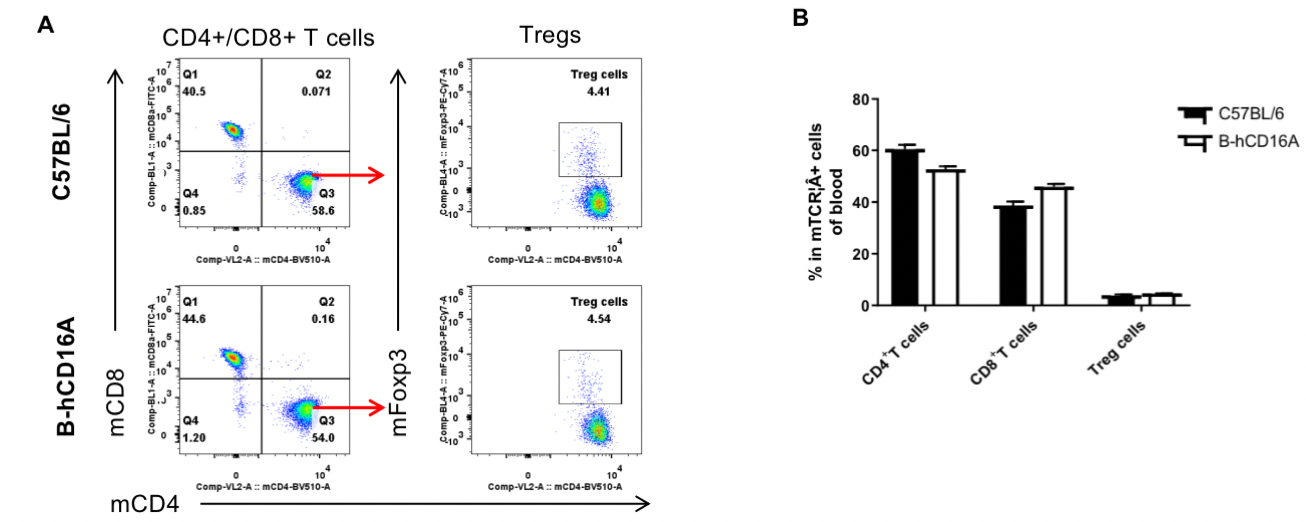
Analysis of blood T cell subpopulations by FACS. Blood were isolated from female C57BL/6 and B-hCD16A mice (n=3, 6-week-old). Flow cytometry analysis of the blood was performed to assess leukocyte subpopulations. A. Representative FACS plots. Single live CD45+ cells were gated for TCRβ+T cell population and used for further analysis as indicated here. B. Results of FACS analysis. Values are expressed as mean ± SEM.
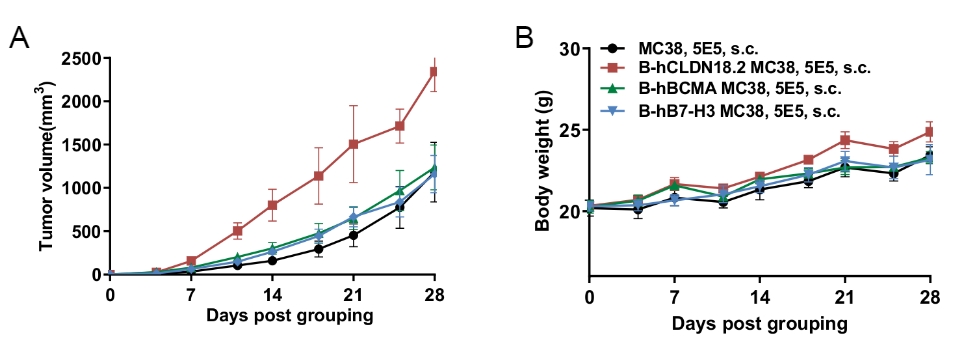
Subcutaneous homograft tumor growth of B-hCLDN18.2 MC38 cells, B-hBCMA MC38 cells and B-hB7-H3 MC38 cells in B-hCD16A mice.
B-hCLDN18.2 MC38 cells, B-hBCMA MC38 cells and B-hB7-H3 MC38 cells (5x10⁵) and wild-type MC38 cells (5x10⁵) were subcutaneously implanted into B-hCD16A mice (female, 8-week-old, n=6). Tumor volume and body weight were measured twice a week. (A) Average tumor volume ± SEM. (B) Body weight (Mean± SEM). Volume was expressed in mm3 using the formula: V=0.5 × long diameter × short diameter2. As shown in panel A, B-hCLDN18.2 MC38 cells, B-hBCMA MC38 cells and B-hB7-H3 MC38 cells were able to establish tumors in B-hCD16A mice and can be used for efficacy studies.
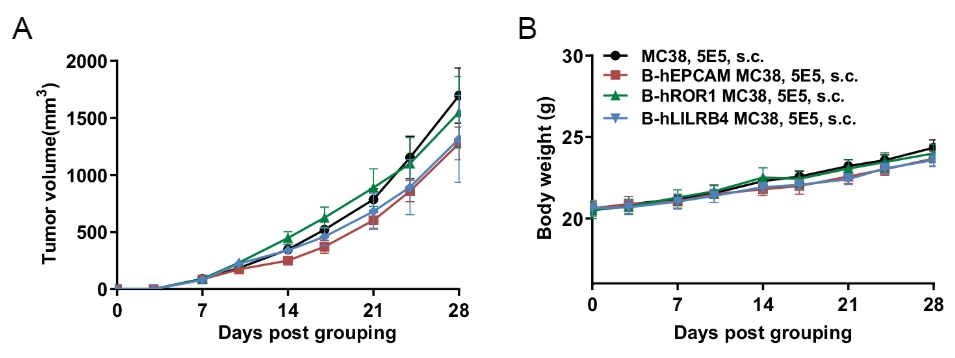
Subcutaneous homograft tumor growth of B-hEPCAM MC38 cells, B-hROR1 MC38 cells and B-hLILRB4 MC38 in B-hCD16A mice.
B-hEPCAM MC38 cells, B-hROR1 MC38 cells and B-hLILRB4 MC38 (5x10⁵) and wild-type MC38 cells (5x10⁵) were subcutaneously implanted into B-hCD16A mice (female, 8-week-old, n=8). Tumor volume and body weight were measured twice a week. (A) Average tumor volume ± SEM. (B) Body weight (Mean± SEM). Volume was expressed in mm3 using the formula: V=0.5 × long diameter × short diameter2. As shown in panel A, B-hEPCAM MC38 cells, B-hROR1 MC38 cells and B-hLILRB4 MC38 were able to establish tumors in B-hCD16A mice and can be used for efficacy studies.
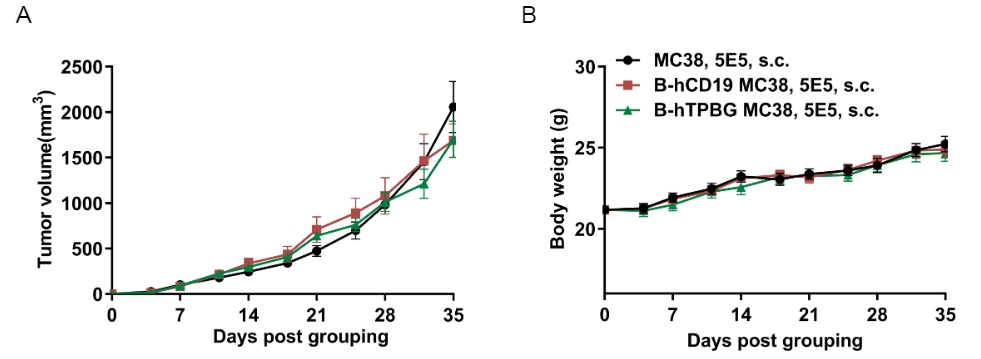
Subcutaneous homograft tumor growth of B-hCD19 MC38 cells and B-hTPBG MC38 in B-hCD16A mice.
B-hCD19 MC38 cells, B-hTPBG MC38 (5x10⁵) and wild-type MC38 cells (5x10⁵) were subcutaneously implanted into B-hCD16A mice (female, 8-week-old, n=8). Tumor volume and body weight were measured twice a week. (A) Average tumor volume ± SEM. (B) Body weight (Mean± SEM). Volume was expressed in mm3 using the formula: V=0.5 × long diameter × short diameter2. As shown in panel A, B-hCD19 MC38 cells and B-hTPBG MC38 were able to establish tumors in B-hCD16A mice and can be used for efficacy studies.
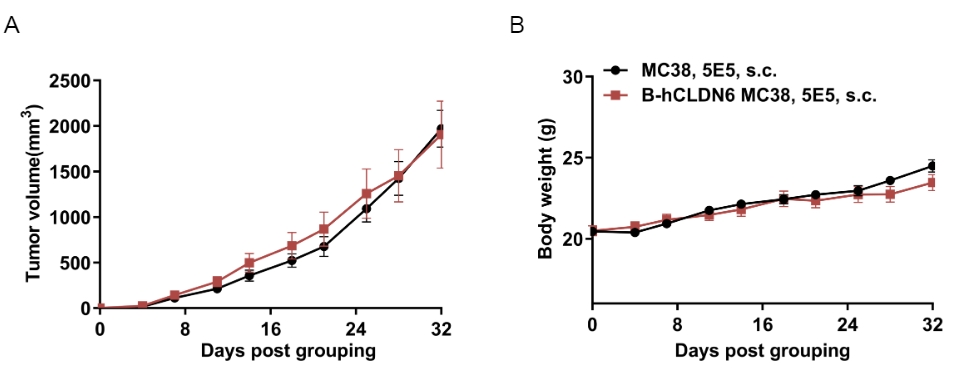
Subcutaneous homograft tumor growth of B-hCLDN6 MC38 cells in B-hCD16A mice.
B-hCLDN6 MC38 (5x10⁵) and wild-type MC38 cells (5x10⁵) were subcutaneously implanted into B-hCD16A mice (female, 8-week-old, n=8). Tumor volume and body weight were measured twice a week. (A) Average tumor volume ± SEM. (B) Body weight (Mean± SEM). Volume was expressed in mm3 using the formula: V=0.5 × long diameter × short diameter2. As shown in panel A, B-hCLDN6 MC38 cells was able to establish tumors in B-hCD16A mice and can be used for efficacy studies.
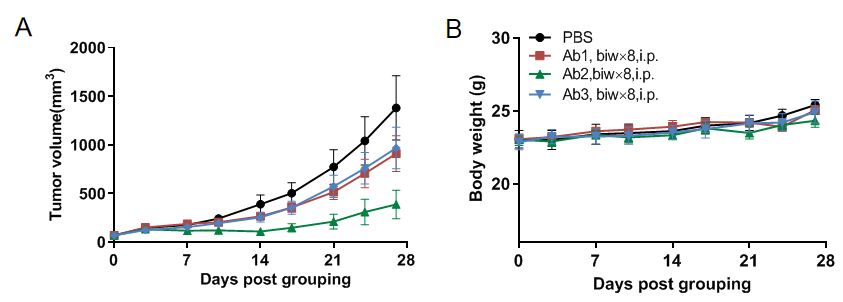
Antitumor activity of anti-human CD16A-based Ab in B-hCD16A mice.
(A) Anti-human CD16A-based Ab inhibited MC38 tumor growth in B-hCD16A mice. Murine colon cancer MC38 cells were subcutaneously implanted into homozygous B-hCD16A mice (female,13-week-old, n=7). Mice were grouped when tumor volume reached approximately 70 mm3, at which time they were treated with anti-human CD16A-based Ab with doses and schedules indicated in panel B. (B) Body weight changes during treatment. As shown in panel A, anti-human CD16A-based Ab was efficacious in controlling tumor growth in B-hCD16A mice, demonstrating that the B-hCD16A mice provide a powerful preclinical model for in vivo evaluation of anti-human CD16A-based Ab. Values are expressed as mean ± SEM.