

BALB/c-Fcgr4tm2(FCGR3A)Bcgen/Bcgen • 111885
| Product name | B-hCD16A mice(C) |
|---|---|
| Catalog number | 111885 |
| Strain name | BALB/c-Fcgr4tm2(FCGR3A)Bcgen/Bcgen |
| Strain background | BALB/cCrSlcNifdc |
| Aliases | FCGR3A (Fc fragment of IgG receptor IIIa), CD16A |
Gene targeting strategy for B-hCD16A mice(C). The regulatory region and exons 1~5 of mouse Fcgr4 gene that encode the full-length protein were replaced by human FCGR3A(F158V) exons 1~6 and regulatory region in B-hCD16A mice(C).
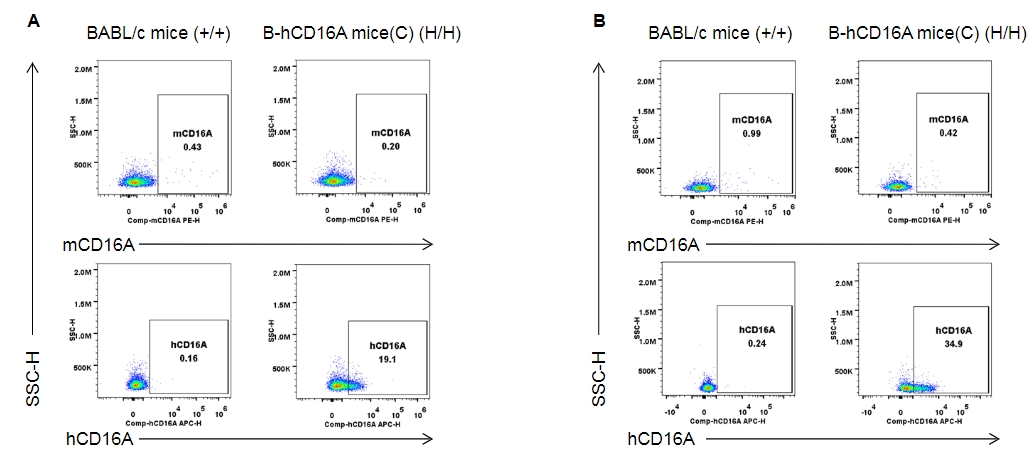
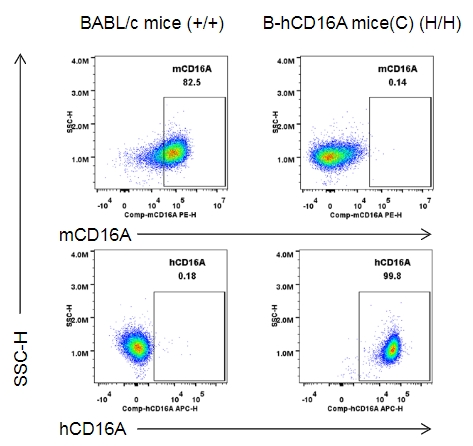
Strain specific CD16A expression analysis in homozygous B-hCD16A mice(C) by flow cytometry. Blood and spleen were collected from wild-type mice (+/+) and homozygous B-hCD16A mice(C) (H/H), and analyzed by flow cytometry with species-specific anti-CD16A antibodies. Mouse CD16A was not detectable in wild-type mice. Human CD16A was only detectable in homozygous B-hCD16A mice(C) blood(A) and spleen(B).
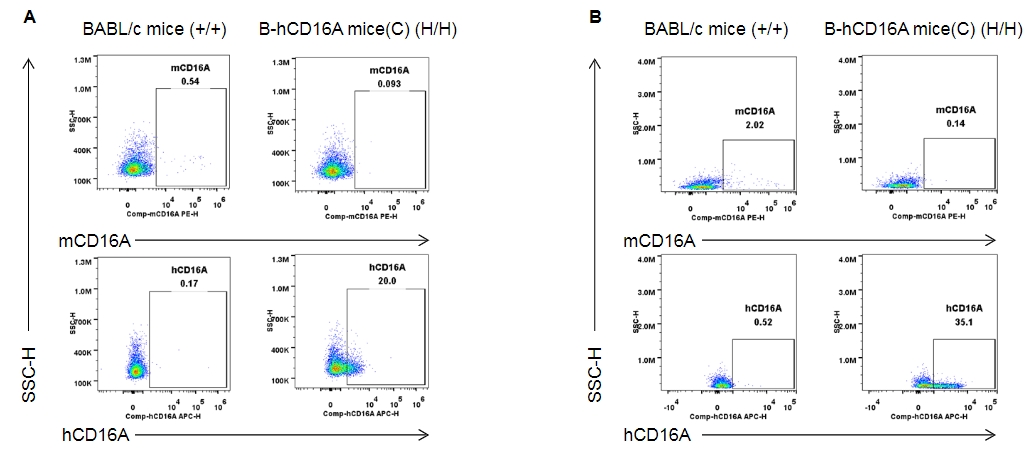
Strain specific CD16A expression analysis in homozygous B-hCD16A mice(C) by flow cytometry. Blood and spleen were collected from wild-type mice (+/+) and homozygous B-hCD16A mice(C) (H/H), and analyzed by flow cytometry with species-specific anti-CD16A antibodies. Mouse CD16A was not detectable in wild-type mice. Human CD16A was only detectable in homozygous B-hCD16A mice(C) blood(A) and spleen(B).
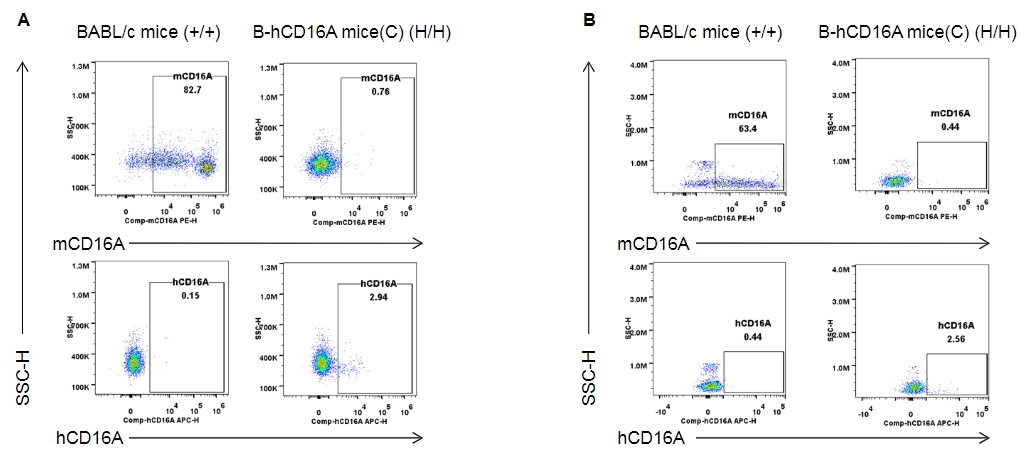
Strain specific CD16A expression analysis in homozygous B-hCD16A mice(C) by flow cytometry. Blood and spleen were collected from wild-type mice (+/+) and homozygous B-hCD16A mice(C) (H/H), and analyzed by flow cytometry with species-specific anti-CD16A antibodies. Mouse CD16A was detectable in wild-type mice. Human CD16A was weakly detectable in homozygous B-hCD16A mice(C) blood(A) and spleen(B).
Strain specific CD16A expression analysis in homozygous B-hCD16A mice(C) by flow cytometry. Blood and spleen were collected from wild-type mice (+/+) and homozygous B-hCD16A mice(C) (H/H), and analyzed by flow cytometry with species-specific anti-CD16A antibodies. Mouse CD16A was detectable in wild-type mice. Human CD16A was only detectable in homozygous B-hCD16A mice(C) blood(A) and spleen(B)
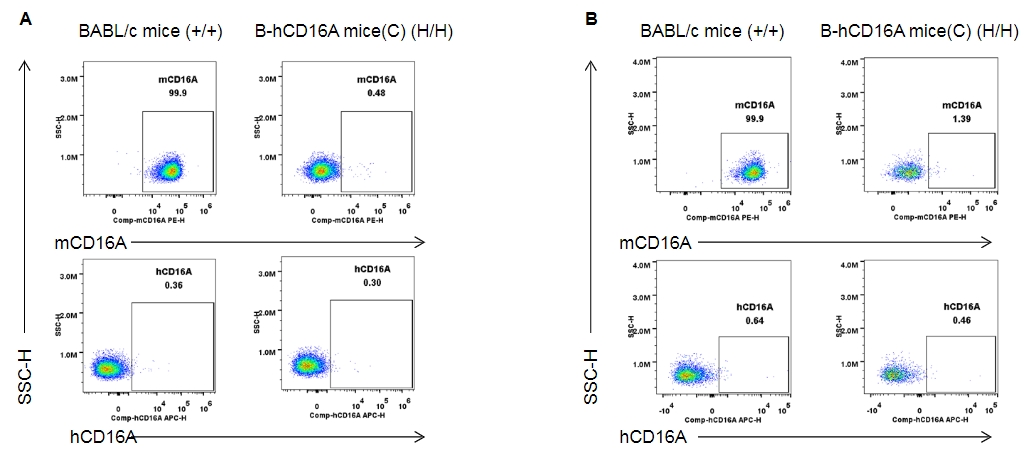
Strain specific CD16A expression analysis in homozygous B-hCD16A mice(C) by flow cytometry. Peritoneal exudative macrophages(PEMs) were collected from wild-type mice (+/+) and homozygous B-hCD16A mice(C) (H/H), and analyzed by flow cytometry with species-specific anti-CD16A antibodies. Mouse CD16A was detectable in wild-type mice. Human CD16A was only detectable in homozygous B-hCD16A mice(C).
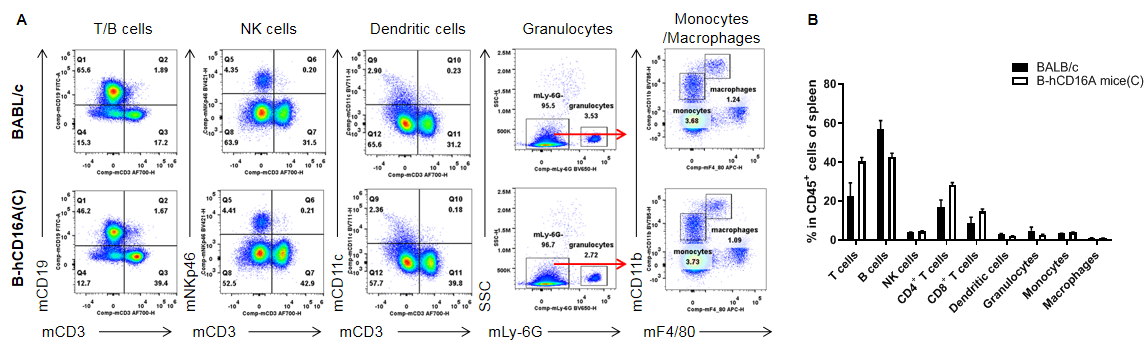
Analysis of spleen leukocyte subpopulations by FACS. Splenocytes were isolated from female BALB/c and B-hCD16A mice(C) (n=3, 7-week-old). Flow cytometry analysis of the splenocytes was performed to assess leukocyte subpopulations. A. Representative FACS plots. Single live cells were gated for the CD45+ population and used for further analysis as indicated here. B. Results of FACS analysis. Values are expressed as mean ± SEM.
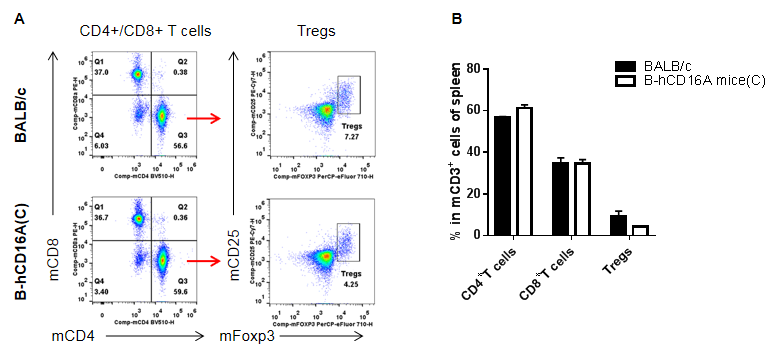
Analysis of spleen T cell subpopulations by FACS. Splenocytes were isolated from female BABL/c and B-hCD16A mice(C) (n=3, 7-week-old). Flow cytometry analysis of the splenocytes was performed to assess leukocyte subpopulations. A. Representative FACS plots. Single live CD45+ cells were gated for CD3+T cell population and used for further analysis as indicated here. B. Results of FACS analysis. Values are expressed as mean ± SEM.
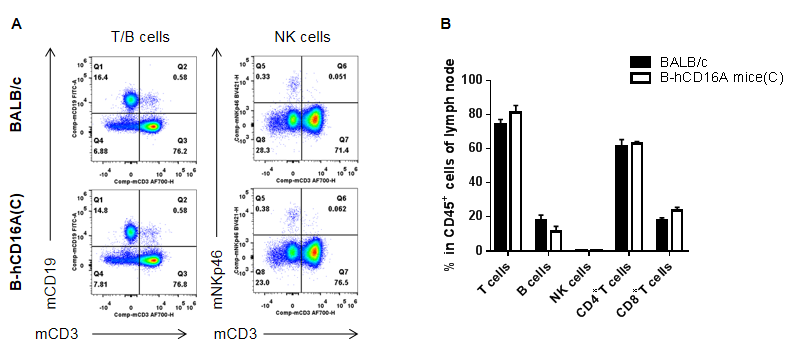
Analysis of LNs leukocyte subpopulations by FACS. LNs were isolated from female BABL/c and B-hCD16A mice(C) (n=3, 7-week-old). Flow cytometry analysis of the LNs was performed to assess leukocyte subpopulations. A. Representative FACS plots. Single live cells were gated for the CD45+ population and used for further analysis as indicated here. B. Results of FACS analysis. Values are expressed as mean ± SEM.
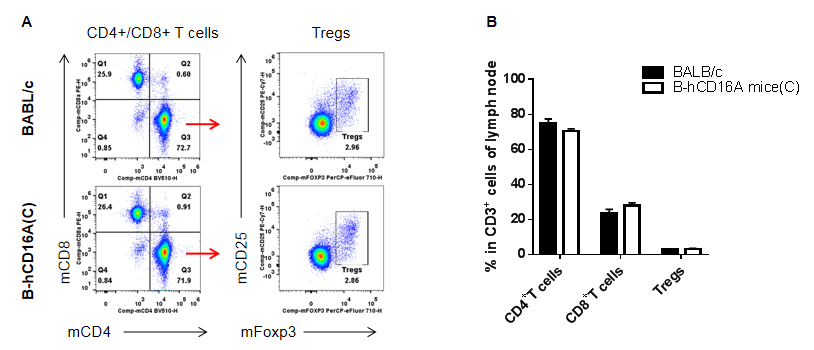
Analysis of LNs T cell subpopulations by FACS. LNs were isolated from female BABL/c and B-hCD16A mice(C) (n=3, 7-week-old). Flow cytometry analysis of the LNs was performed to assess leukocyte subpopulations. A. Representative FACS plots. Single live CD45+ cells were gated for CD3+T cell population and used for further analysis as indicated here. B. Results of FACS analysis. Values are expressed as mean ± SEM.
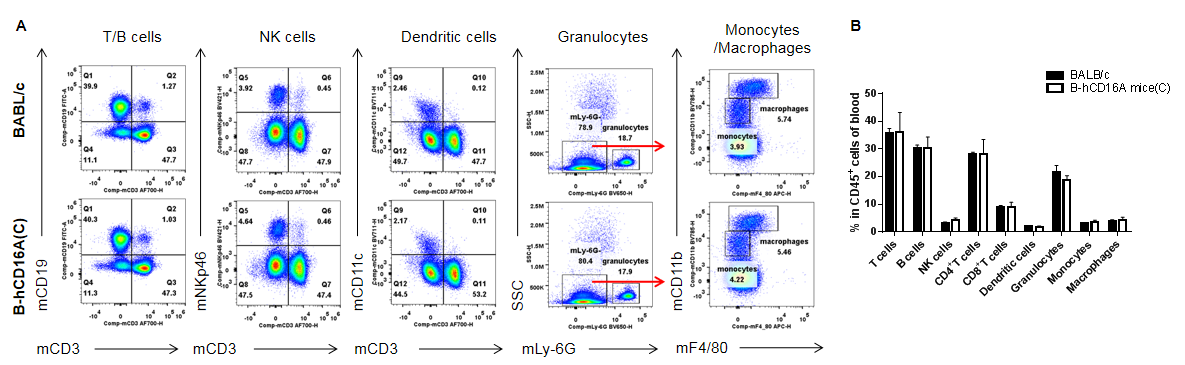
Analysis of blood leukocyte subpopulations by FACS. Blood were isolated from female BABL/c and B-hCD16A mice(C) (n=3, 7-week-old). Flow cytometry analysis of the blood was performed to assess leukocyte subpopulations. A. Representative FACS plots. Single live cells were gated for the CD45+ population and used for further analysis as indicated here. B. Results of FACS analysis. Values are expressed as mean ± SEM.
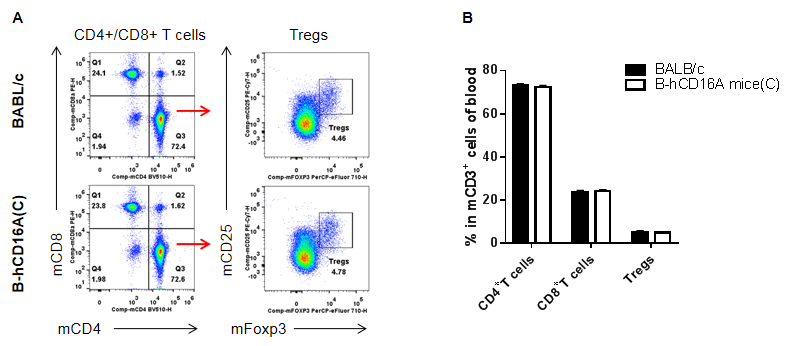
Analysis of blood T cell subpopulations by FACS. Blood were isolated from female BABL/c and B-hCD16A mice(C) (n=3, 7-week-old). Flow cytometry analysis of the blood was performed to assess leukocyte subpopulations. A. Representative FACS plots. Single live CD45+ cells were gated for CD3+T cell population and used for further analysis as indicated here. B. Results of FACS analysis. Values are expressed as mean ± SEM.
