

C57BL/6N-Cd28tm1(CD28)Bcgen/Bcgen • 110007
| Product name | B-hCD28 mice |
|---|---|
| Catalog number | 110007 |
| Strain name | C57BL/6N-Cd28tm1(CD28)Bcgen/Bcgen |
| Strain background | C57BL/6N |
| NCBI gene ID | 12487 |
| Aliases | CD28 (Cluster of Differentiation 28) |
Gene targeting strategy for B-hCD28 mice.
The exons 2-3 of mouse Cd28 gene that encode the extracellular domain were replaced by human CD28 exons 2-3 in B-hCD28 mice.
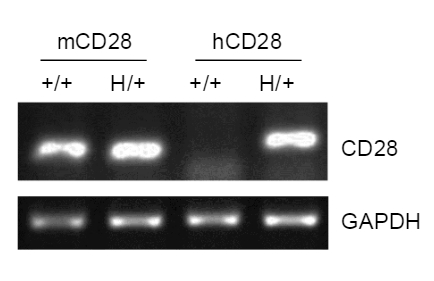
Strain specific analysis of CD28 gene expression in WT and B-hCD28 mice by RT-PCR.
Mouse Cd28 mRNA was detectable in splenocytes of wild-type (+/+) and heterozygous (H/+) mice. Human CD28 mRNA was detectable only in H/+, but not in +/+ mice.
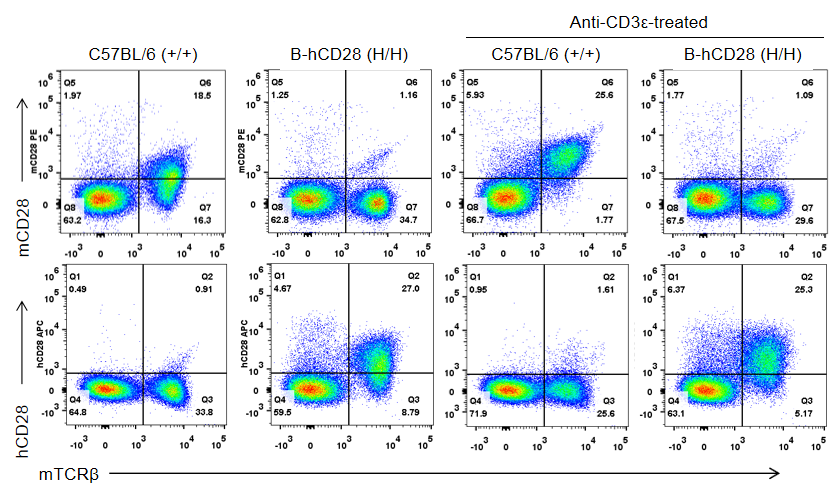
Strain specific CD28 expression analysis in homozygous B-hCD28 mice by flow cytometry.
Splenocytes were collected from wild-type C57BL/6 mice (+/+) and homozygous B-hCD28 mice (H/H) stimulated with or without anti-CD3ε antibody in vivo, and analyzed by flow cytometry with species-specific anti-CD28 antibodies. Mouse CD28 was detectable in wild-type C57BL/6 mice. Human CD28 was exclusively detectable in homozygous B-hCD28 mice but not in wild-type C57BL/6 mice.
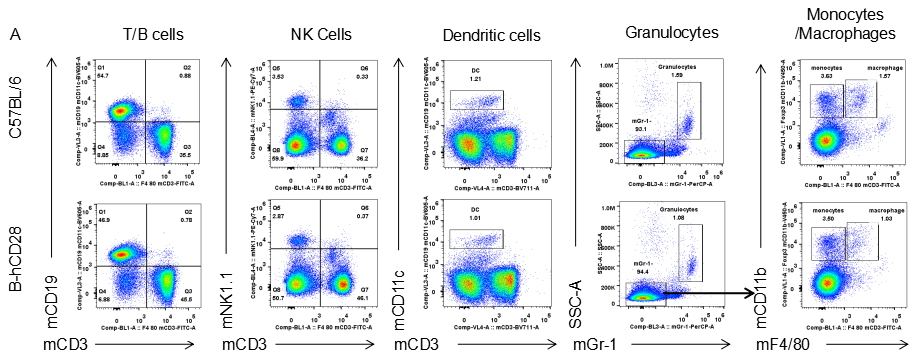
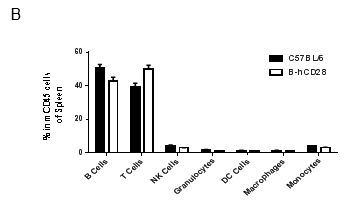
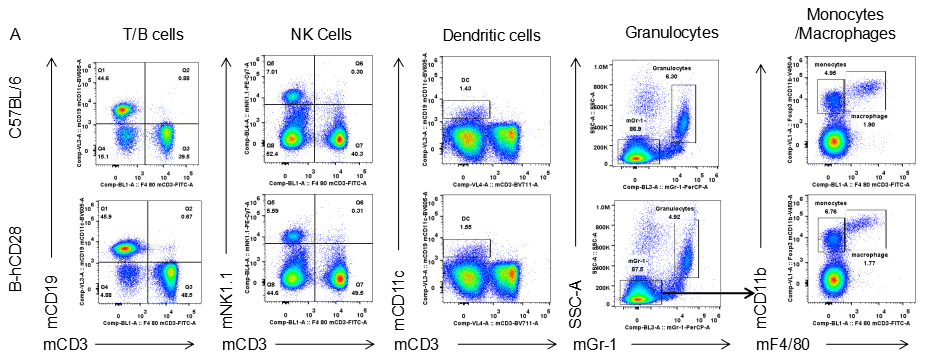
Analysis of spleen leukocyte subpopulations by FACS.
Splenocytes were isolated from female C57BL/6 and B-hCD28 mice (n=3, 6 week-old). Flow cytometry analysis of the splenocytes was performed to assess leukocyte subpopulations. A. Representative FACS plots. Single live cells were gated for CD45 population and used for further analysis as indicated here. B. Results of FACS analysis. Percent of T, B, NK, Monocyte, DC and macrophage cells in homozygous B-hCD28 mice were similar to those in the C57BL/6 mice, demonstrating that introduction of hCD28 in place of its mouse counterpart does not change the overall development, differentiation or distribution of these cell types in spleen.
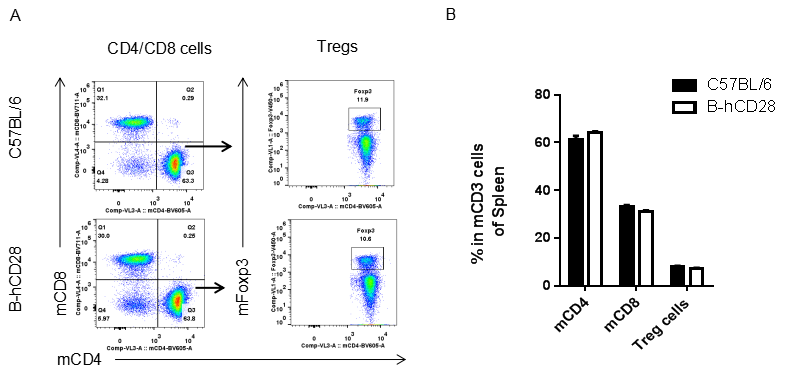
Analysis of spleen T cell subpopulations by FACS.
Splenocytes were isolated from female C57BL/6 and B-hCD28 mice (n=3, 6-week-old). Flow cytometry analysis of the splenocytes was performed to assess leukocyte subpopulations. A. Representative FACS plots. Single live CD45+ cells were gated for CD3 T cell population and used for further analysis as indicated here. B. Results of FACS analysis. Percent of CD8, CD4, and Treg cells in homozygous B-hCD28 mice were similar to those in the C57BL/6 mice, demonstrating that introduction of hCD28 in place of its mouse counterpart does not change the overall development, differentiation or distribution of these T cell subtypes in spleen. Values are expressed as mean ± SEM.
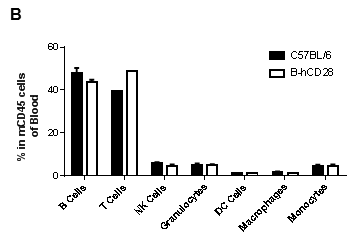
Analysis of blood leukocyte subpopulations by FACS.
Blood were isolated from female C57BL/6 and B-hCD28 mice (n=3, 6-week-old). Flow cytometry analysis of the splenocytes was performed to assess leukocyte subpopulations. A. Representative FACS plots. Single live cells were gated for CD45 population and used for further analysis as indicated here. B. Results of FACS analysis. Percent of T, B, NK, Monocyte, DC and macrophage cells in homozygous B-hCD28 mice were similar to those in the C57BL/6 mice, demonstrating that introduction of hCD28 in place of its mouse counterpart does not change the overall development, differentiation or distribution of these cell types in blood.
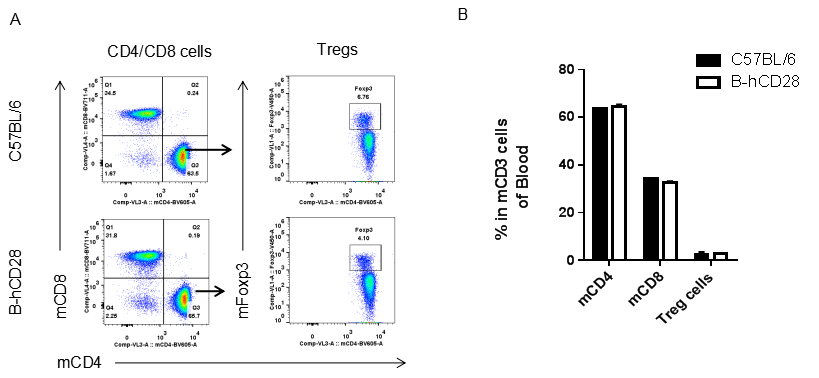
Analysis of blood T cell subpopulations by FACS.
Leukocytes were isolated from female C57BL/6 and B-hCD28 mice (n=3, 6-week-old). Flow cytometry analysis of the leukocytes was performed to assess leukocyte subpopulations. A. Representative FACS plots. Single live CD45+ cells were gated for CD3 T cell population and used for further analysis as indicated here. B. Results of FACS analysis. Percent of CD8, CD4, and Treg cells in homozygous B-hCD28 mice were similar to those in the C57BL/6 mice, demonstrating that introduction of hCD28 in place of its mouse counterpart does not change the overall development, differentiation or distribution of these T cell subtypes in blood. Values are expressed as mean ± SEM.
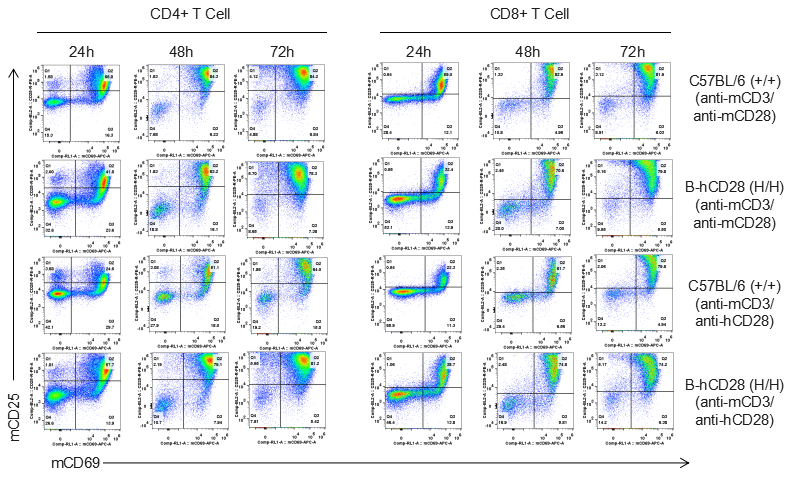
Analysis of T cell activation stimulated with anti-CD3 and anti-CD28 antibody in vitro.
Homozygous B-hCD28 mice were treated with anti-mCD3e antibody and anti-mCD28 antibody or anti-hCD28 antibody as indicated on the graph (female, 6-week-old, n=3). T cells were analyzed at 24, 48 and 72 hours after treatment. Anti-mCD28 antibody resulted in an increased activation of T cells in WT mice, and anti-hCD28 antibody resulted in an increased activation of T cells in B-hCD28 mice. Values are expressed as mean ± SEM.
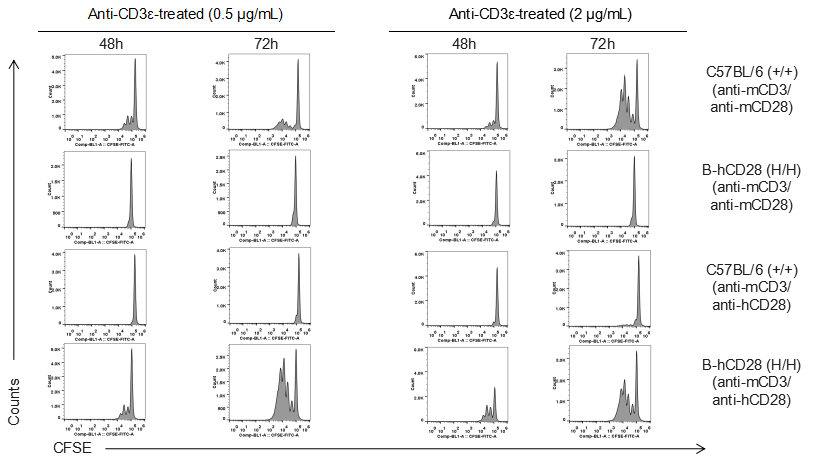
Analysis of T cell proliferaion stimulated with anti-CD3 and anti-CD28 antibody in vitro. Homozygous B-hCD28 mice were treated with anti-mCD3e antibody and anti-mCD28 antibody or anti-hCD28 antibody as indicated on the graph (female, 6-week-old, n=3). T cells were analyzed at 48 and 72 hours after treatment. Anti-mCD28 antibody resulted in an increased proliferation of T cells in WT mice, and anti-hCD28 antibody resulted in an increased proliferation of T cells in B-hCD28 mice. Values are expressed as mean ± SEM.
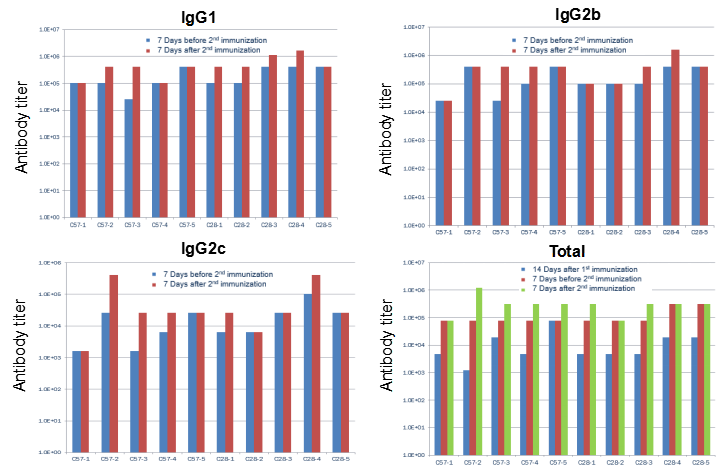
hPD-L1 recombination protein immunization led to unchanged IgG profile in B-hCD28 mice.
C57BL/6 and B-hCD28 mice (female, 6-week-old, n=5) were immunized by hPD-L1 recombination protein with CFA. No difference was found in serum antibody titer in WT and hCD28 mice, indicating that the B7-1/CD28 co-stimulating signaling pathway was normal in B-hCD28 mice.
T cells from WT, and homozygous hCD28 mice were treated with anti-mCD3e antibody and anti-mCD28 antibody or anti-hCD28 antibody in vitro. IFN-γ and IL-2 expression levels were analyzed.
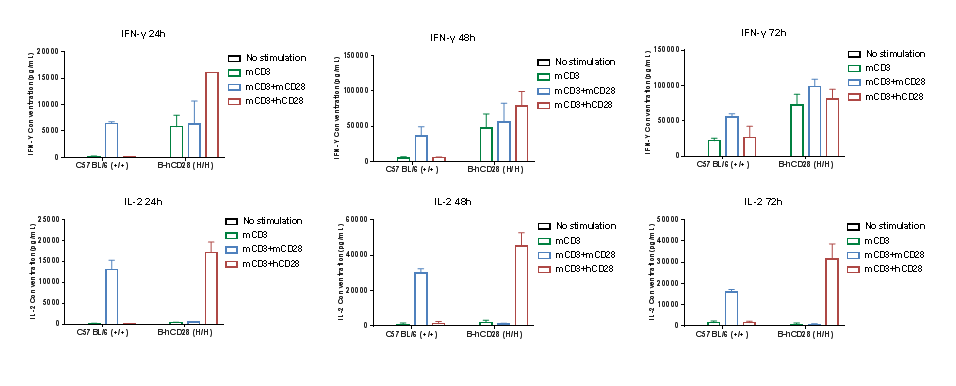
Anti-human CD28 therapies led to changed cytokine profile in B-hCD28 mice.
Homozygous B-hCD28 mice were treated with anti-mCD3e antibody and anti-mCD28 antibody or anti-hCD28 antibody as indicated on the graph (female, 6-week-old, n=3). Serum cytokine levels were analyzed at 24, 48 and 72 hours after treatment. Anti-mCD28 antibody resulted in an increase of IFN-γ, IL-2 in WT mice, and anti-hCD28 antibody resulted in an increase of IFN-γ, IL-2 in B-hCD28 mice. Values are expressed as mean ± SEM.
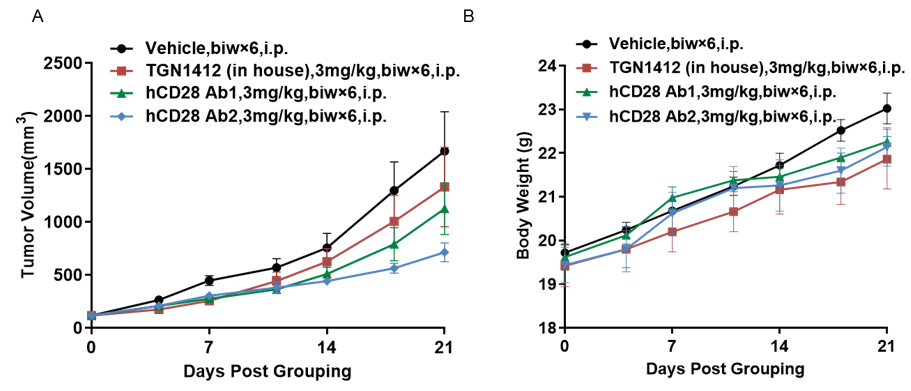
Antitumor activity of anti-human CD28 antibody in B-hCD28 mice.
(A) Anti-human CD28 antibody inhibited MC38 tumor growth in B-hCD28 mice. Murine colon cancer MC38 cells were subcutaneously implanted into homozygous B-hCD28 mice (female, 6-7 week-old, n=5). Mice were grouped when tumor volume reached approximately 100 mm3, at which time they were treated with anti-human CD28 antibody with doses and schedules indicated in panel. (B) Body weight changes during treatment. As shown in panel A, two anti-human CD28 antibody were efficacious in controlling tumor growth in B-hCD28 mice, demonstrating that the B-hCD28 mice provide a powerful preclinical model for in vivo evaluation of anti-human CD28 antibody. Values are expressed as mean ± SEM.
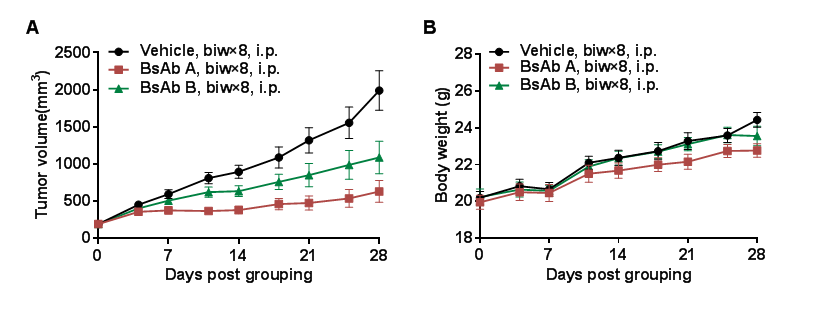
Antitumor activity of anti-PD-L1 and anti-CD28 (PD-L1xCD28) bispecific antibody (BsAb) in B-hCD28 mice.
Murine colon cancer B-hPD-L1 MC38 plus cells were subcutaneously implanted into homozygous B-hCD28 mice (female, 7-8 week-old, n=10). Mice were grouped when tumor volume reached approximately 200 mm3, at which time they were treated with anti-human PD-L1xCD28 BsAbs provided by the client. (A) anti-human PD-L1xCD28 BsAbs inhibited B-hPD-L1 MC38 plus cells tumor growth in B-hCD28 mice. (B) Body weight changes during treatment. As shown in panel A, anti-human PD-L1xCD28 BsAbs were efficacious in controlling tumor growth in B-hCD28 mice, demonstrating that the B-hCD28 mice provide a powerful preclinical model for in vivo evaluation of anti-human PD-L1xCD28 BsAbs. Values are expressed as mean ± SEM.
