

C57BL/6-Cd3etm2(CD3E)Bcgen Epcamtm1(EPCAM)Bcgen/Bcgen • 112519
| Product name | B-hCD3E/hEPCAM mice |
|---|---|
| Catalog number | 112519 |
| Strain name | C57BL/6-Cd3etm2(CD3E)Bcgen Epcamtm1(EPCAM)Bcgen/Bcgen |
| Strain background | C57BL/6 |
| Aliases | CD3E (CD3E molecule);EPCAM (Ber-Ep4, BerEp4, DIAR5, EGP-2, EGP314, EGP40, ESA,HNPCC8, KS1/4, KSA, M4S1, MIC18, MK-1, MOC-31, TACSTD1, TROP1) |
Gene targeting strategy for B-hCD3E/hEPCAM mice.
The exons 2-6 of mouse Cd3e gene that encode the extracellular domain were replaced by human CD3E exons 2-7 in B-hCD3E/hEPCAM mice. The exons 3-8 of mouse Epcam gene that encode the extracellular domain were replaced by human EPCAM exons 2-7 in B-hCD3E/hEPCAM mice.
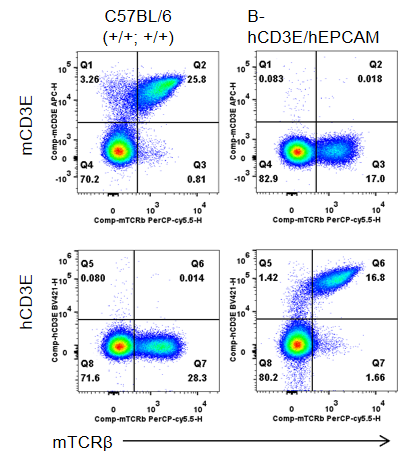
Strain specific CD3E expression analysis in homozygous B-hCD3E/hEPCAM mice by flow cytometry. Splenocytes were collected from wild type (WT) mice (+/+; +/+) and homozygous B-hCD3E/hEPCAM mice (H/H; H/H), and analyzed by flow cytometry with species-specific anti-CD3E antibody. Mouse CD3E was detectable in WT mice (+/+; +/+). Human CD3E was exclusively detectable in homozygous B-hCD3E/hEPCAM mice (H/H; H/H) but not in WT mice (+/+; +/+).
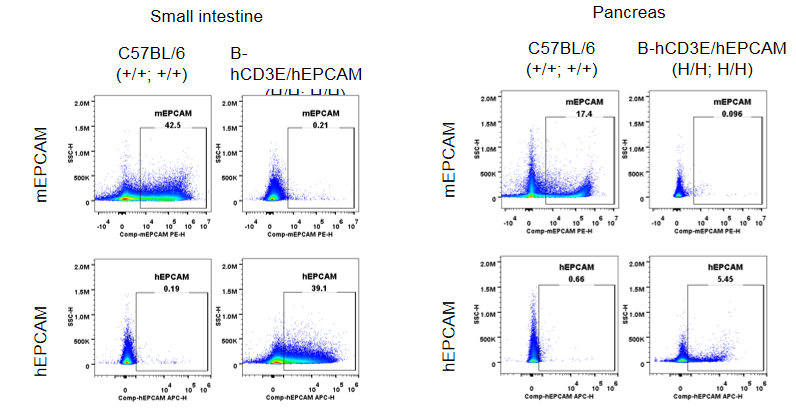
Strain specific EPCAM expression analysis in homozygous B-hCD3E/hEPCAM mice by flow cytometry. Small intestine and pancreas were collected from wild type (WT) mice (+/+; +/+) and homozygous B-hCD3E/hEPCAM mice (H/H; H/H), and analyzed by flow cytometry with species-specific anti-EPCAM antibody. Mouse EPCAM was detectable in WT mice (+/+; +/+). Human EPCAM was exclusively detectable in homozygous B-hCD3E/hEPCAM mice (H/H; H/H) but not in WT mice (+/+; +/+).
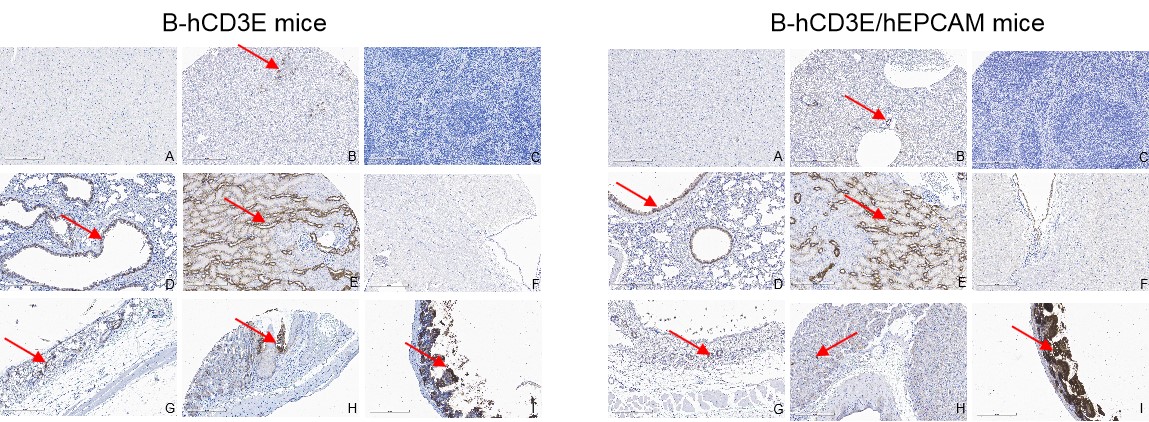
Immunohistochemical (IHC) Analysis of EPCAM Protein Expression in B-hCD3E and B-hCD3E/hEPCAM Mice Tissues were collected from B-hCD3E mice and homozygous B-hCD3E/hEPCAM mice (3 females, 8 weeks old) for IHC analysis. Tissues from B-hCD3E mice were stained with an anti-mouse EPCAM antibody (abcam, ab221552), while tissues from B-hCD3E/hEPCAM mice were stained with an anti-human EPCAM antibody (abcam, ab223582). The results demonstrated that mouse EPCAM (in B-hCD3E mice) and humanized EPCAM (in B-hCD3E/hEPCAM mice) were expressed in the liver (B), lung (D), kidney (E), skin (G), stomach (H), and ileum (I). In contrast, no EPCAM expression was detected in the heart (A), spleen (C), or brain (F). These findings indicate that the expression profile of humanized EPCAM in B-hCD3E/hEPCAM mice is consistent with that of mouse EPCAM in B-hCD3E mice, confirming that humanization did not alter the tissue-specific expression pattern of EPCAM. Positive signals are indicated by arrows in the figure.
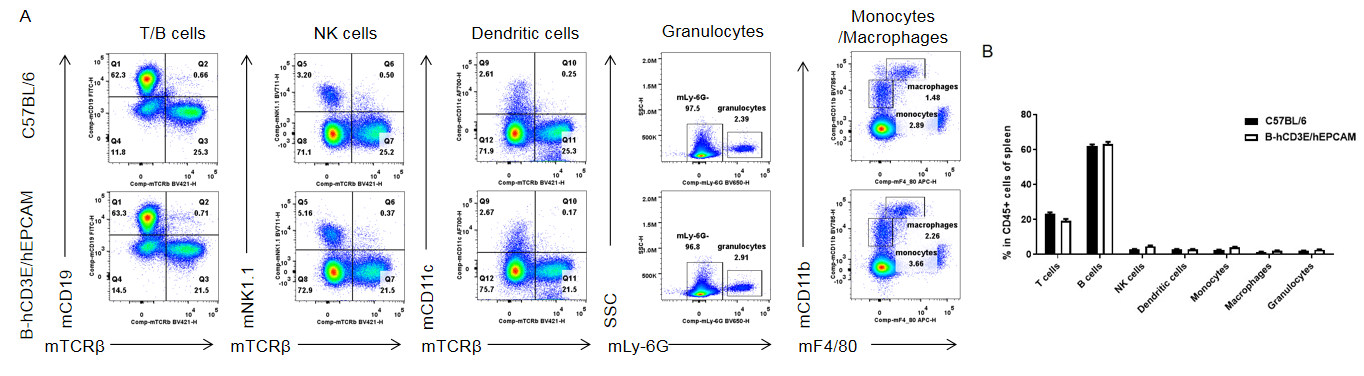
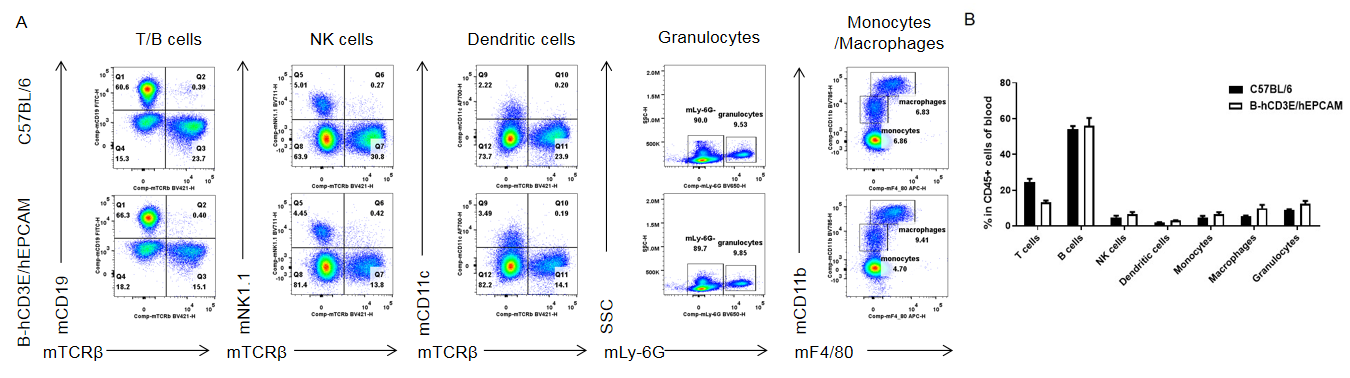
Analysis of spleen leukocyte subpopulations by FACS. Splenocytes were isolated from female C57BL/6 and B-hCD3E/hEPCAM mice (n=3, 8 week-old). Flow cytometry analysis of the splenocytes was performed to assess leukocyte subpopulations. A. Representative FACS plots. Single live cells were gated for CD45 population and used for further analysis as indicated here. B. Results of FACS analysis. Percent of T cells, B cells, NK cells, dendritic cells, granulocytes, monocytes and macrophages in homozygous B-hCD3E/hEPCAM mice were similar to those in the C57BL/6 mice, demonstrating that introduction of hCD3E and hEPCAM in place of its mouse counterpart do not change the overall development, differentiation or distribution of these cell types in spleen. Values are expressed as mean ± SEM.
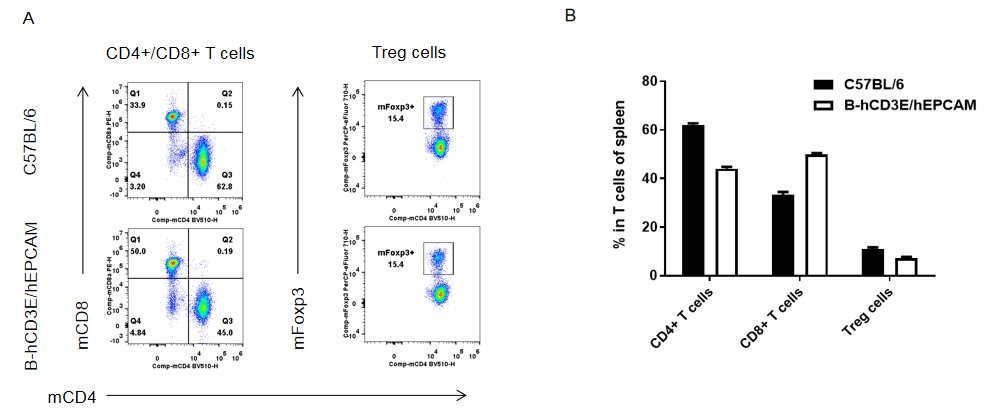
Analysis of spleen T cell subpopulations by FACS. Splenocytes were isolated from female C57BL/6 and B-hCD3E/hEPCAM mice (n=3, 8 week-old). Flow cytometry analysis of the splenocytes was performed to assess T cell subsets. A. Representative FACS plots. Single live CD45+ cells were gated for CD3 T cell population and used for further analysis as indicated here. B. Results of FACS analysis. Percent of CD8+ T cells, CD4+ T cells and Treg cells in homozygous B-hCD3E/hEPCAM mice were similar to those in the C57BL/6 mice, demonstrating that introduction of hCD3E and hEPCAM in place of its mouse counterpart do not change the overall development, differentiation or distribution of these T cell sub types in spleen. Values are expressed as mean ± SEM.
Analysis of blood leukocyte subpopulations by FACS. Blood cells were isolated from female C57BL/6 and B-hCD3E/hEPCAM mice (n=3, 8 week-old). Flow cytometry analysis of the blood leukocytes was performed to assess leukocyte subpopulations. A. Representative FACS plots. Single live cells were gated for CD45 population and used for further analysis as indicated here. B. Results of FACS analysis. Percent of T cells, B cells, NK cells, dendritic cells, granulocytes, monocytes and macrophages in homozygous B-hCD3E/hEPCAM mice were similar to those in the C57BL/6 mice, demonstrating that introduction of hCD3E and hEPCAM in place of its mouse counterpart do not change the overall development, differentiation or distribution of these cell types in blood. Values are expressed as mean ± SEM.
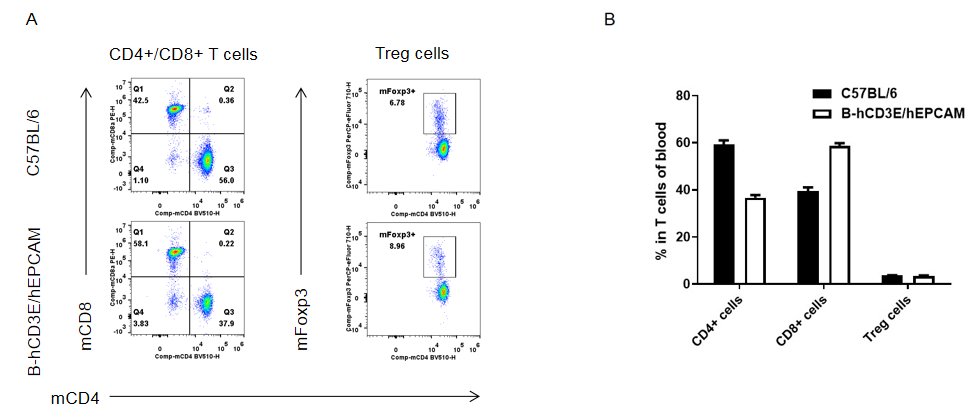
Analysis of blood T cell subpopulations by FACS. Blood cells were isolated from female C57BL/6 and B-hCD3E/hEPCAM mice (n=3, 8 week-old). Flow cytometry analysis of the leukocytes was performed to assess T cell subsets. A. Representative FACS plots. Single live CD45+ cells were gated for CD3 T cell population and used for further analysis as indicated here. B. Results of FACS analysis. Percent of CD8+ T cells, CD4+ T cells and Treg cells in homozygous B-hCD3E/hEPCAM mice were similar to those in the C57BL/6 mice, demonstrating that introduction of hCD3E and hEPCAM in place of its mouse counterpart do not change the overall development, differentiation or distribution of these T cell sub types in blood. Values are expressed as mean ± SEM.
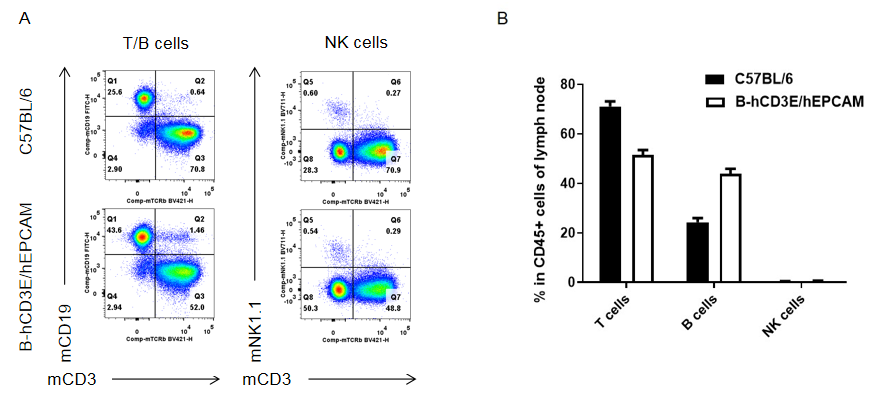
Analysis of lymph node leukocyte subpopulations by FACS. Leukocytes were isolated from female C57BL/6 and B-hCD3E/hEPCAM mice (n=3, 8 week-old). Flow cytometry analysis of the leukocytes was performed to assess leukocyte subpopulations. A. Representative FACS plots. Single live cells were gated for CD45 population and used for further analysis as indicated here. B. Results of FACS analysis. Percent of T cells, B cells and NK cells in homozygous B-hCD3E/hEPCAM mice were similar to those in the C57BL/6 mice, demonstrating that introduction of hCD3E and hEPCAM in place of its mouse counterpart do not change the overall development, differentiation or distribution of these cell types in lymph node. Values are expressed as mean ± SEM.
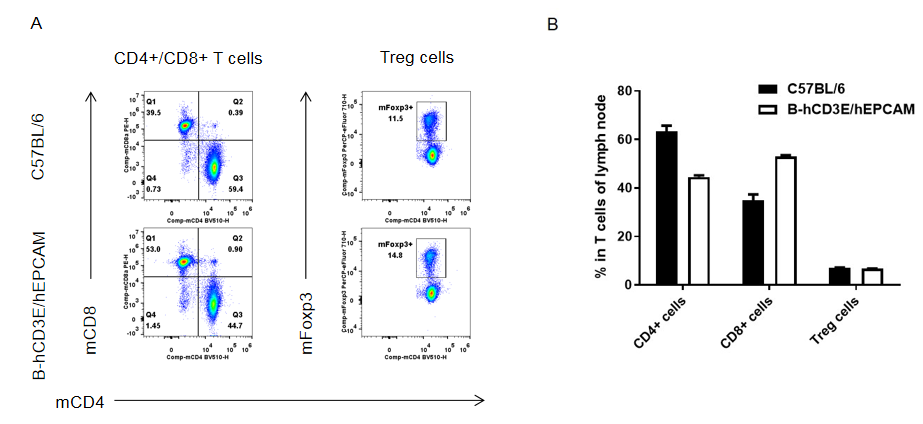
Analysis of lymph node T cell subpopulations by FACS. Leukocytes were isolated from female C57BL/6 and B-hCD3E/hEPCAM mice (n=3, 8 week-old). Flow cytometry analysis of the leukocytes was performed to assess T cell subsets. A. Representative FACS plots. Single live CD45+ cells were gated for CD3 T cell population and used for further analysis as indicated here. B. Results of FACS analysis. Percent of CD8+ T cells, CD4+ T cells and Treg cells in homozygous B-hCD3E/hEPCAM mice were similar to those in the C57BL/6 mice, demonstrating that introduction of hCD3E and hEPCAM in place of its mouse counterpart do not change the overall development, differentiation or distribution of these T cell sub types in lymph node. Values are expressed as mean ± SEM.
