

C57BL/6-Nt5etm1(hNT5E)BcgenEntpd1tm3(hENTPD1)Bcgen/Bcgen • 111855
| Product name | B-hCD73/hCD39 mice |
|---|---|
| Catalog number | 111855 |
| Strain name | C57BL/6-Nt5etm1(hNT5E)BcgenEntpd1tm3(hENTPD1)Bcgen/Bcgen |
| Strain background | C57BL/6 |
| Aliases | NT5E (NT, eN, NT5, NTE, eNT, CD73, E5NT, CALJA);ENTPD1 (CD39, SPG64, ATPDase, NTPDase-1) |
Gene targeting strategy for B-hCD73/hCD39 mice. The human NT5E whole coding sequence was inserted following the 5’UTR of the mouse Nt5e in B-hCD73/hCD39 mice. A chimeric coding sequences of human ENTPD1 gene encoding the extracellular region and mouse Entpd1 gene encoding the second transmembrane and cytoplasmic region were inserted in exon 2 where it is after the first transmembrane region of mouse Entpd1 gene in B-hCD73/hCD39 mice. Meanwhile the sequences of mouse Entpd1 gene encoding the extracellular region on exon 2 and the following sequences on part of intron 2-3 were replaced with the chimeric coding sequences.
Gene targeting strategy for B-hCD73/hCD39 mice. The human NT5E whole coding sequence was inserted following the 5’UTR of the mouse Nt5e in B-hCD73/hCD39 mice. A chimeric coding sequences of human ENTPD1 gene encoding the extracellular region and mouse Entpd1 gene encoding the second transmembrane and cytoplasmic region were inserted in exon 2 where it is after the first transmembrane region of mouse Entpd1 gene in B-hCD73/hCD39 mice. Meanwhile the sequences of mouse Entpd1 gene encoding the extracellular region on exon 2 and the following sequences on part of intron 2-3 were replaced with the chimeric coding sequences.
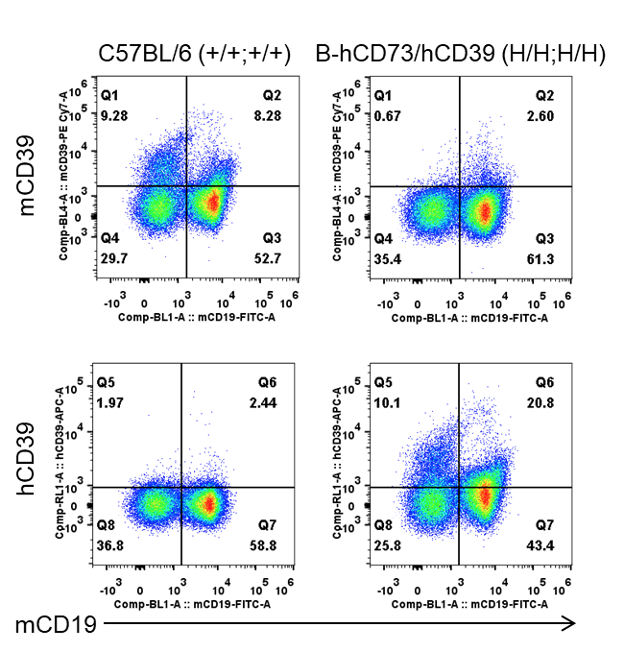
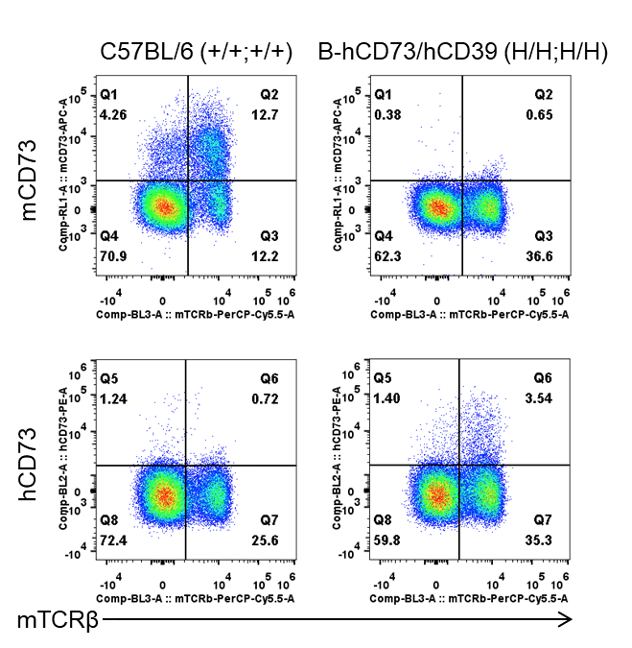
Strain specific CD39 expression analysis in homozygous B-hCD73/hCD39 mice by flow cytometry. Splenocytes were collected from wild-type C57BL/6 mice (+/+;+/+) and homozygous B-hCD73/hCD39 mice (H/H;H/H), and analyzed by flow cytometry with species-specific anti-CD39 antibody. Mouse CD39 was detectable in wild-type mice. Human CD39 was exclusively detectable in homozygous B-hCD73/hCD39 mice but not in wild-type mice.
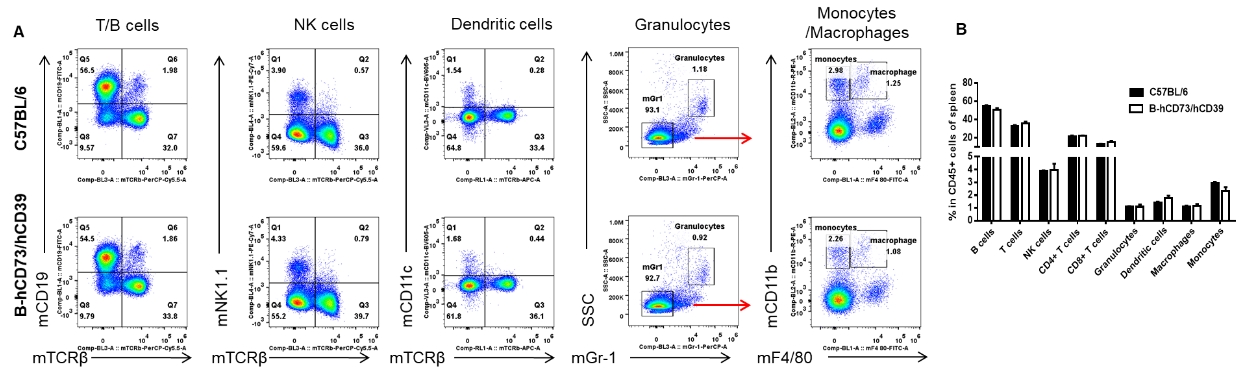
Analysis of spleen leukocyte subpopulations by FACS. Splenocytes were isolated from female C57BL/6 and B-hCD73/hCD39 mice (n=3, 10-week-old). Flow cytometry analysis of the splenocytes was performed to assess leukocyte subpopulations. A. Representative FACS plots. Single live cells were gated for the CD45+ population and used for further analysis as indicated here. B. Results of FACS analysis. Percent of T cells, B cells, NK cells, dendritic cells, granulocytes, monocytes and macrophages in homozygous B-hCD73/hCD39 mice were similar to those in the C57BL/6 mice, demonstrating that CD73/CD39 humanized does not change the overall development, differentiation or distribution of these cell types in spleen. Values are expressed as mean ± SEM.
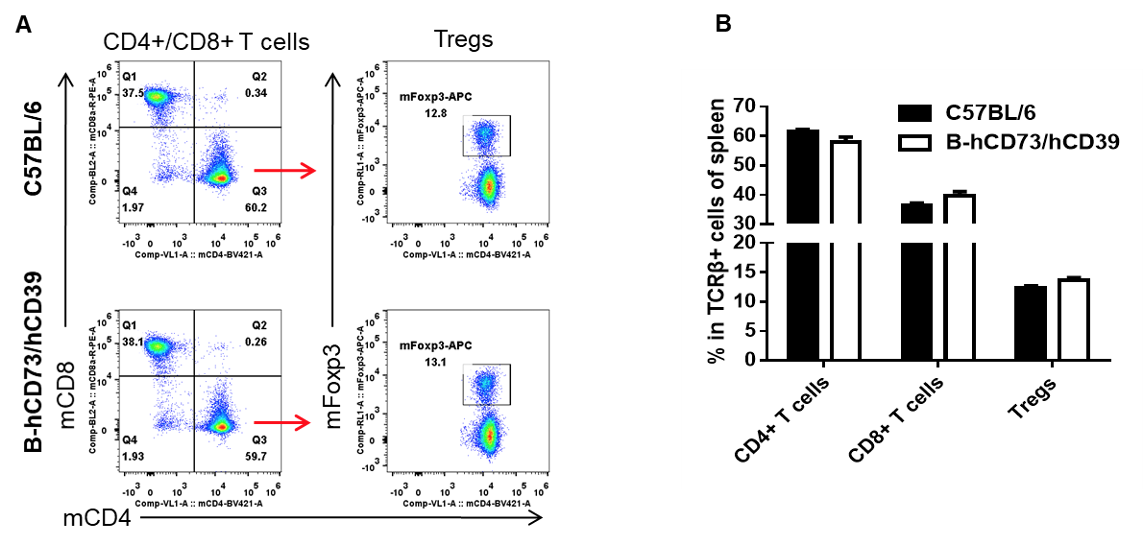
Analysis of spleen T cell subpopulations by FACS. Splenocytes were isolated from female C57BL/6 and B-hCD73/hCD39 mice (n=3, 10-week-old). Flow cytometry analysis of the splenocytes was performed to assess leukocyte subpopulations. A. Representative FACS plots. Single live CD45+ cells were gated for TCRβ+ T cell population and used for further analysis as indicated here. B. Results of FACS analysis. The percent of CD8+ T cells, CD4+ T cells and Tregs in homozygous B-hCD73/hCD39 mice were similar to those in the C57BL/6 mice, demonstrating that introduction of CD73/CD39 in place of its mouse counterpart does not change the overall development, differentiation or distribution of these T cell subtypes in spleen. Values are expressed as mean ± SEM.

Analysis of lymph node leukocyte subpopulations by FACS. Leukocytes were isolated from female C57BL/6 and B-hCD73/hCD39 mice (n=3, 10-week-old). Flow cytometry analysis of the leukocytes was performed to assess leukocyte subpopulations. A. Representative FACS plots. Single live cells were gated for CD45+ population and used for further analysis as indicated here. B. Results of FACS analysis. The percent of T cells, B cells and NK cells in homozygous B-hCD73/hCD39 mice were similar to those in the C57BL/6 mice, demonstrating that introduction of CD73/CD39 in place of its mouse counterpart does not change the overall development, differentiation or distribution of these cell types in lymph node. Values are expressed as mean ± SEM.
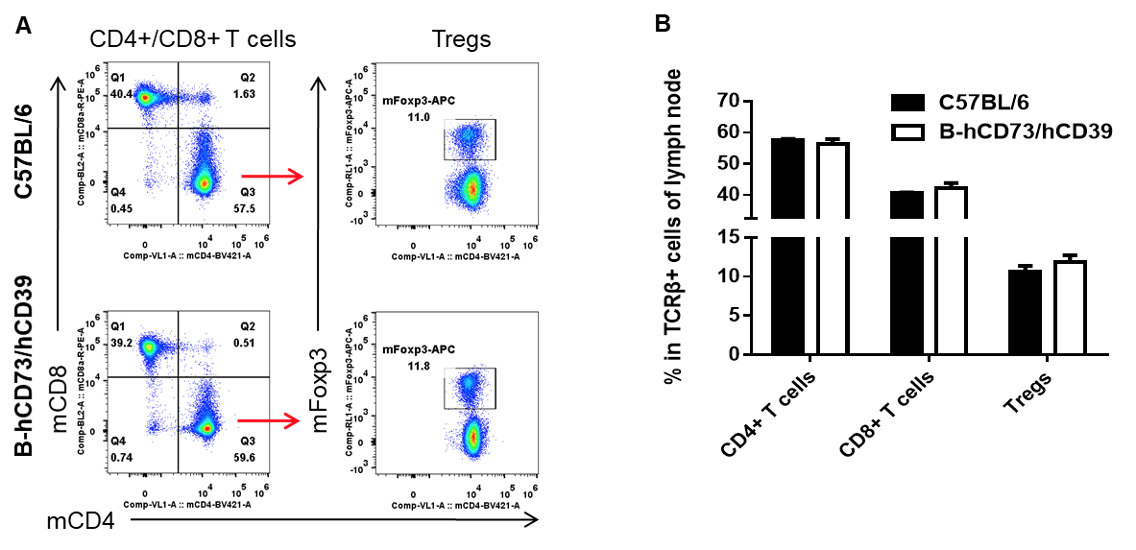
Analysis of lymph node T cell subpopulations by FACS. Leukocytes were isolated from female C57BL/6 and B-hCD73/hCD39 mice (n=3, 10-week-old). Flow cytometry analysis of the leukocytes was performed to assess leukocyte subpopulations. A. Representative FACS plots. Single live CD45+ cells were gated for TCRβ+ T cell population and used for further analysis as indicated here. B. Results of FACS analysis. The percent of CD8+ T cells, CD4+ T cells and Tregs in homozygous B-hCD73/hCD39 mice were similar to those in the C57BL/6 mice, demonstrating that introduction of CD73/CD39 in place of its mouse counterpart does not change the overall development, differentiation or distribution of these T cell subtypes in lymph node. Values are expressed as mean ± SEM.
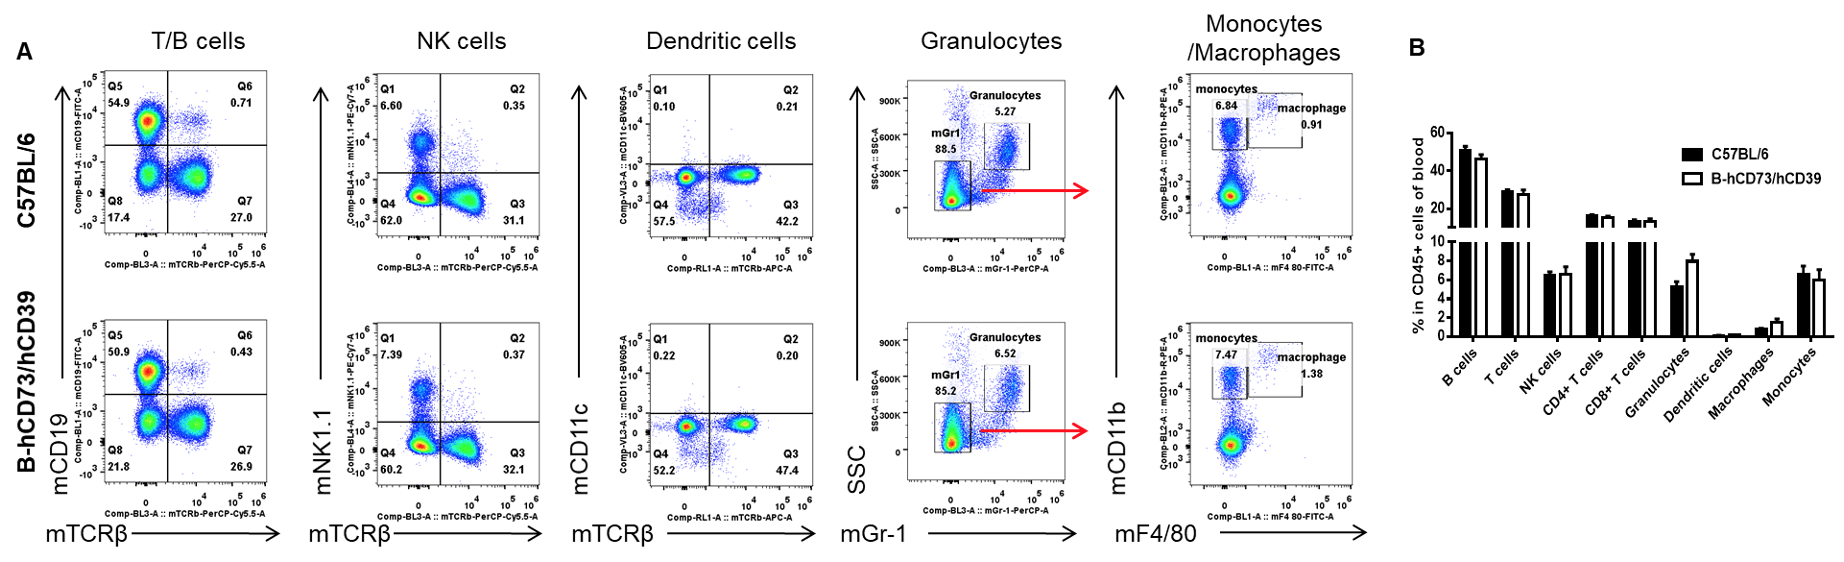
Analysis of blood leukocyte subpopulations by FACS. Leukocytes were isolated from female C57BL/6 and B-hCD73/hCD39 mice (n=3, 10-week-old). Flow cytometry analysis of the blood was performed to assess leukocyte subpopulations. A. Representative FACS plots. Single live cells were gated for the CD45+ population and used for further analysis as indicated here. B. Results of FACS analysis. Percent of T cells, B cells, NK cells, dendritic cells, granulocytes, monocytes and macrophages in homozygous B-hCD73/hCD39 mice were similar to those in the C57BL/6 mice, demonstrating that CD73/CD39 humanized does not change the overall development, differentiation or distribution of these cell types in blood. Values are expressed as mean ± SEM.
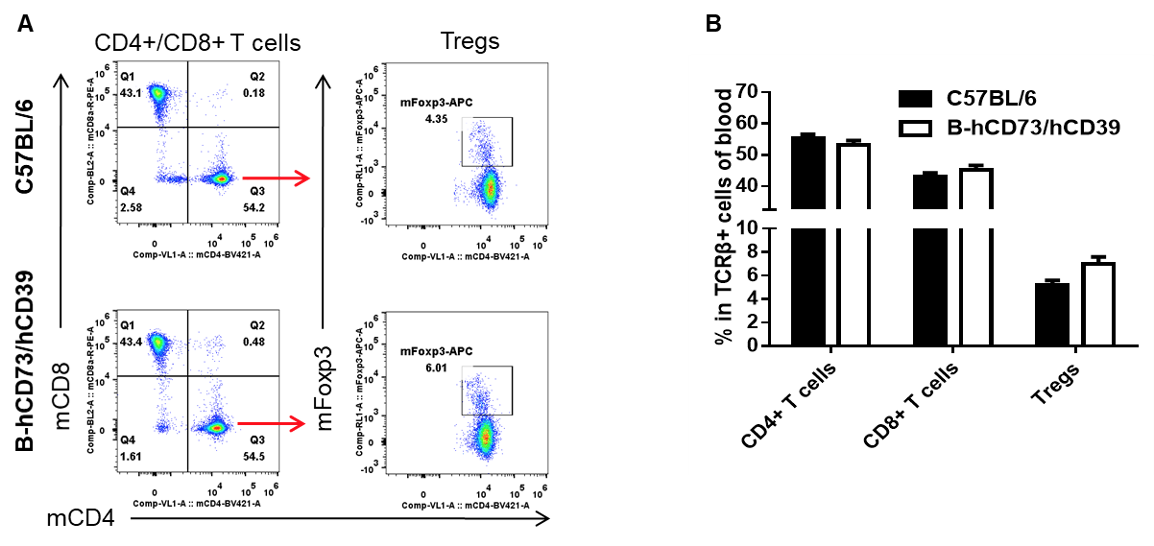
Analysis of blood T cell subpopulations by FACS. Leukocytes were isolated from female C57BL/6 and B-hCD73/hCD39 mice (n=3, 10-week-old). Flow cytometry analysis of the blood was performed to assess leukocyte subpopulations. A. Representative FACS plots. Single live CD45+ cells were gated for TCRβ+ T cell population and used for further analysis as indicated here. B. Results of FACS analysis. The percent of CD8+ T cells, CD4+ T cells and Tregs in homozygous B-hCD73/hCD39 mice were similar to those in the C57BL/6 mice, demonstrating that introduction of CD73/CD39 in place of its mouse counterpart does not change the overall development, differentiation or distribution of these T cell subtypes in blood. Values are expressed as mean ± SEM.
