

C57BL/6-Il6tm1(IL6)BcgenIl6rtm2(IL6R)Bcgen/Bcgen • 120557
| Product name | B-hIL6/hIL6R mice |
|---|---|
| Catalog number | 120557 |
| Strain name | C57BL/6-Il6tm1(IL6)BcgenIl6rtm2(IL6R)Bcgen/Bcgen |
| Strain background | C57BL/6 |
| NCBI gene ID | 16193,16194 |
| Aliases | IL6: CDF; HGF; HSF; BSF2; IL-6; BSF-2; IFNB2; IFN-beta-2IL6R: IL6Q; gp80; CD126; IL6RA; IL6RQ; IL-6RA; IL-6R-1 |
Gene targeting strategy for B-hIL6/hIL6R mice. The exons 2-5 of mouse Il6 gene that encode the full-length protein were replaced by human IL6 exons 2-5 in B-hIL6/hIL6R mice. The CDS of human IL6R gene was inserted after the start codon ATG of mouse Il6ra gene in B-hIL6/hIL6R mice.
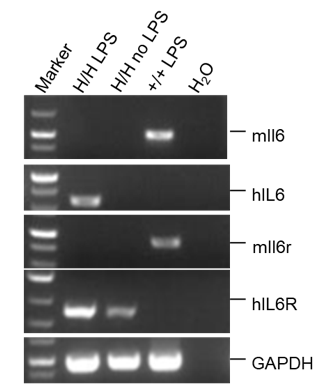
Strain specific analysis of IL6 and IL6R gene expression in B-hIL6/hIL6R mice by RT-PCR. Mouse Il6 and Il6r mRNA were detectable in spleen of wild-type mice (+/+). Human IL6 was detectable only in homozygous B-hIL6/hIL6R mice (H/H) after stimulated with LPS for 3h. Human IL6R mRNA was detectable in homozygous B-hIL6/hIL6R mice, but not in wild-type mice with or without LPS stimulation.
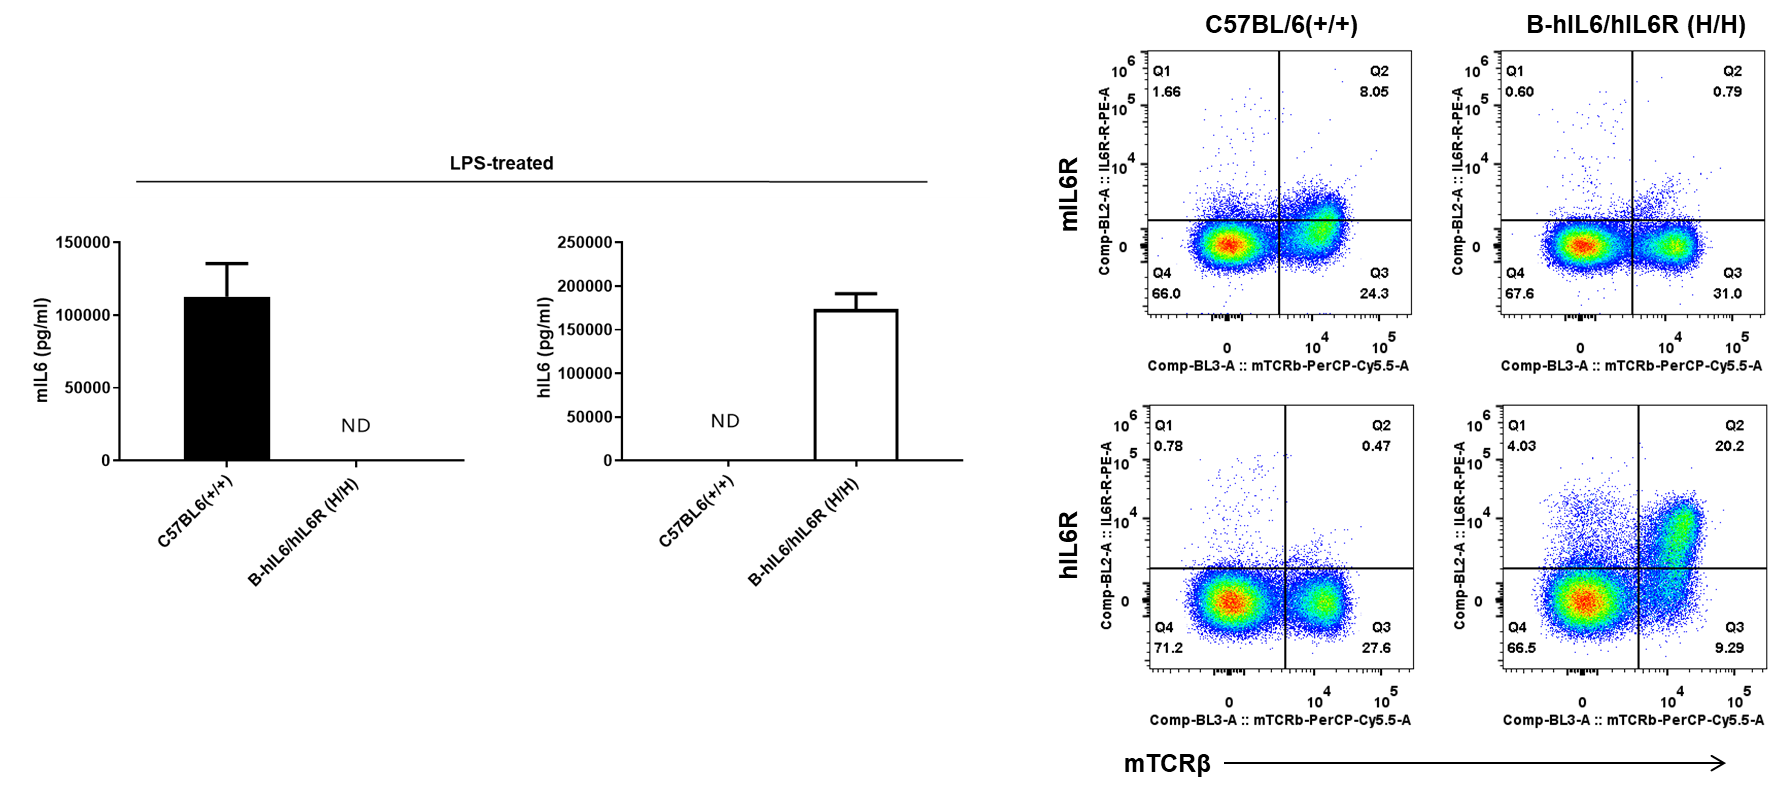
Strain specific IL6 and IL6R expression analysis in homozygous B-hIL6/hIL6R mice. (A) Serum was collected from WT (+/+) and homozygous B-hIL6/hIL6R mice (H/H) stimulated with LPS (Sigma, L2630; 0.1 mg/mL, 200 μL/mouse, i.p.) in vivo for 3 hrs (female, 18-week-old, n=3). Expression level of mouse and human IL6 were analyzed by ELISA (anti-mouse IL6 antibody: Biolegend, 431308; anti-human IL6 antibody: Biolegend, 430508). Mouse IL6 was detectable in WT mice. Human IL6 was exclusively detectable in homozygous B-hIL6/hIL6R mice but not in WT mice. (B) Splenocytes were collected from WT (+/+) and homozygous B-hIL6/hIL6R mice (H/H). Protein expression was analyzed with anti-mouse IL6R antibody (Biolegend, 115805) and anti-human IL6R antibody (Biolegend, 352803) by flow cytometry. Mouse IL6R was detectable in WT mice. Human IL6R was exclusively detectable in homozygous B-hIL6/hIL6R mice but not in WT mice.
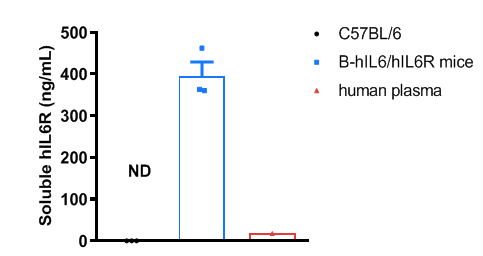
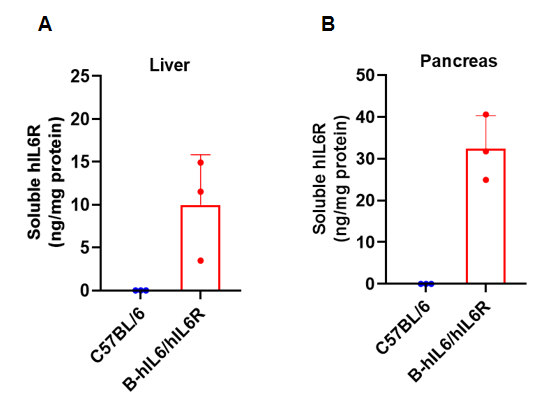
Strain specific IL6R expression analysis in wild-type C57BL/6 mice and homozygous humanized B-hIL6/IL6R mice by ELISA. Plasma (EDTA) was collected from wild-type C57BL/6 mice (female, 6-week-old, n=3) and homozygous B-hIL6/IL6R mice (female, 6-week-old, n=3). Expression level of human IL6R were analyzed by ELISA (human IL6R ELISA kit: R&D, DR600). Human IL6R was exclusively detectable in homozygous B-hIL6/IL6R mice. Values are expressed as mean ± SEM.
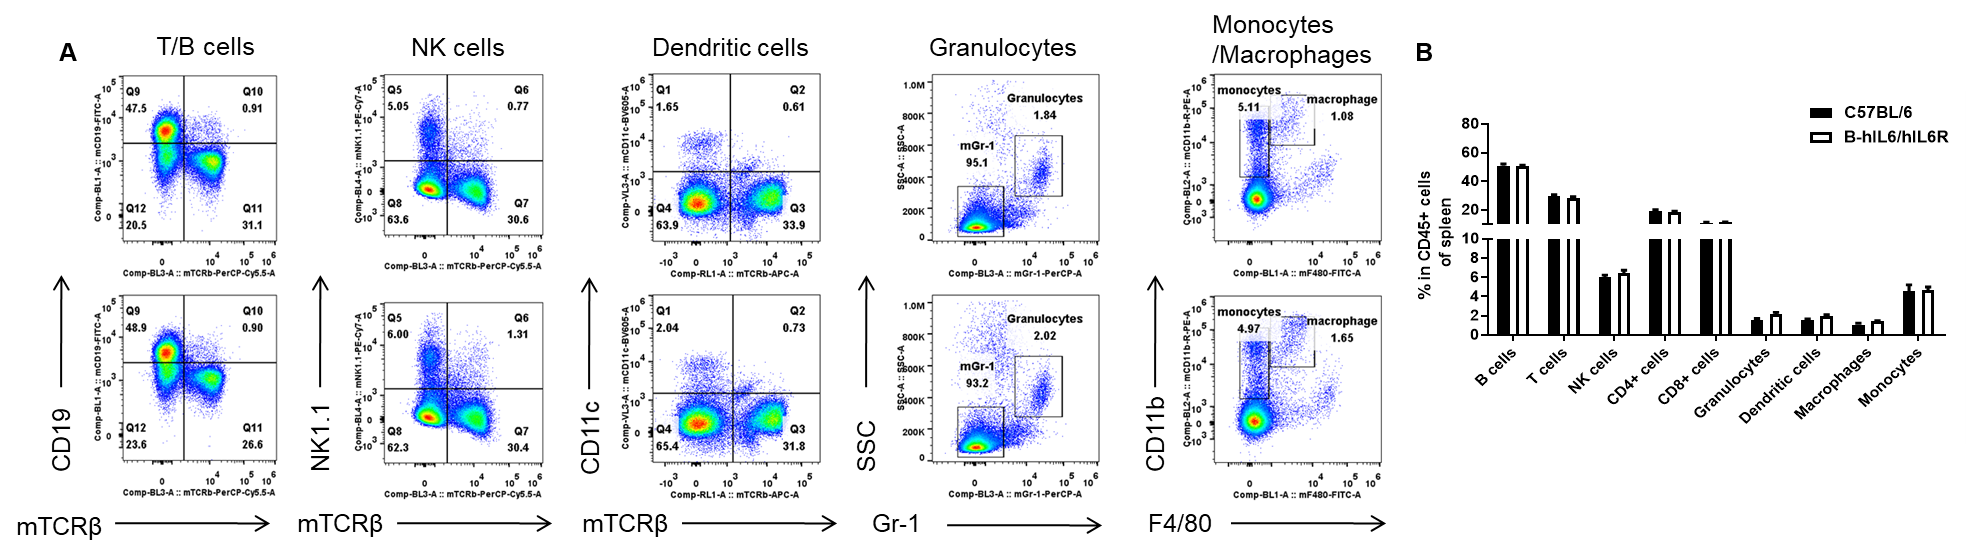
Analysis of spleen leukocyte subpopulations by FACS. Splenocytes were isolated from female C57BL/6 and B-hIL6/hIL6R mice (n=3, 6-week-old). Flow cytometry analysis of the splenocytes were performed to assess leukocyte subpopulations. (A) Representative FACS plots. Single live cells were gated for the CD45+ population and used for further analysis as indicated here. (B) Results of FACS analysis. Percent of T cell, B cell, NK cell, monocyte, dendritic cell and macrophage in homozygous B-hIL6/hIL6R mice were similar to those in the C57BL/6 mice, demonstrating that IL6 and IL6R humanized does not change the overall development, differentiation or distribution of these cell types in spleen. Values are expressed as mean ± SEM.
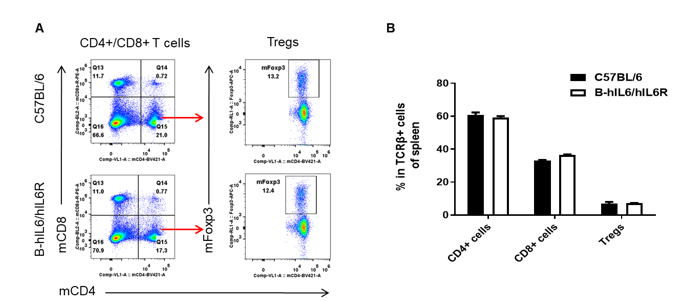
Analysis of spleen T cell subpopulations by FACS. Splenocytes were isolated from female C57BL/6 and B-hIL6/hIL6R mice (n=3, 6-week-old). Flow cytometry analysis of the splenocytes were performed to assess leukocyte subpopulations. (A) Representative FACS plots. Single live CD45+ cells were gated for TCRβ+ T cell population and used for further analysis as indicated here. (B) Results of FACS analysis. Percent of CD8+ T cells, CD4+ T cells, and Treg cells in homozygous B-hIL6/hIL6R mice were similar to those in the C57BL/6 mice, demonstrating that IL6 and IL6R humanized does not change the overall development, differentiation or distribution of these cell types in spleen. Values are expressed as mean ± SEM.
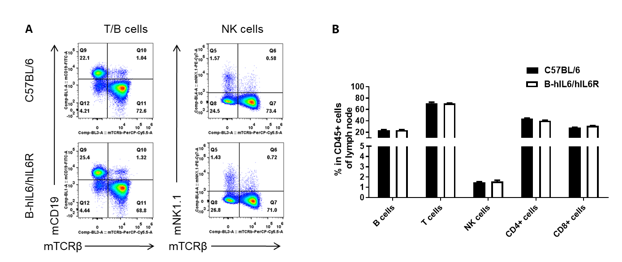
Analysis of lymph node leukocyte subpopulations by FACS. Leukocytes were isolated from female C57BL/6 and B-hIL6/hIL6R mice (n=3, 6-week-old) Flow cytometry analysis of the leukocytes was performed to assess leukocyte subpopulations. (A) Representative FACS plots. Single live cells were gated for the CD45+ population and used for further analysis as indicated here. (B) Results of FACS analysis. Percent of T cell, B cell and NK cell in homozygous B-hIL6/hIL6R mice were similar to those in the C57BL/6 mice, demonstrating that introduction of hIL6/hIL6R in place of its mouse counterpart does not change the overall development, differentiation or distribution of these cell types in lymph node. Values are expressed as mean ± SEM.
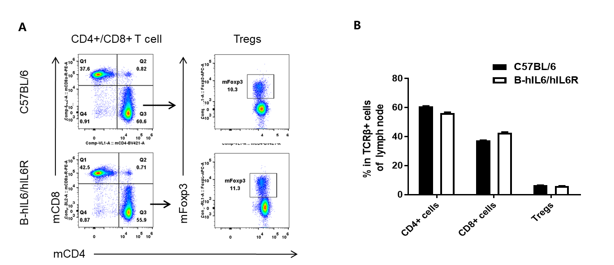
Analysis of lymph node T cell subpopulations by FACS. Leukocytes were isolated from female C57BL/6 and B-hIL6/hIL6R mice (n=3, 6 week-old). Flow cytometry analysis of the leukocytes was performed to assess leukocyte subpopulations. (A) Representative FACS plots. Single live CD45+ cells were gated for TCRβ+ T cell population and used for further analysis as indicated here. (B) Results of FACS analysis. Percent of CD8+ cell, CD4+ cell, and Treg in homozygous B-hIL6/hIL6R mice were similar to those in the C57BL/6 mice, demonstrating that IL6 and IL6R humanized does not change the overall development, differentiation or distribution of these T cell subtypes in lymph node. Values are expressed as mean ± SEM.
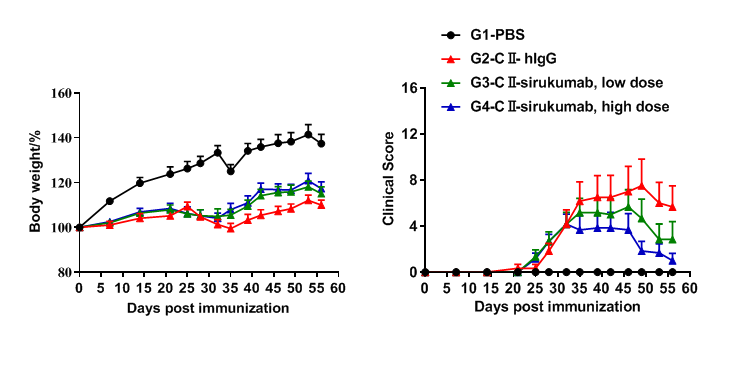
Efficacy of anti-human IL6 antibodies in B-hIL6/hIL6R mice with collagen induced arthritis (CIA) model. Mice in each group were treated with sirukumab (in house). Body weight change(A) and clinical score (B) were evaluated during treatment twice a week. There was no significant change in body weight, while total clinical score increased in the groups except control during days 21 to 28. It indicated that the arthritis mouse model had been constructed successfully. Clinical scores decreased in the two groups treated with sirukumab and dose-dependent. The results indicated the B-hIL6/hIL6R mice provide a powerful preclinical model for in vivo evaluation of anti-human IL6 antibodies.
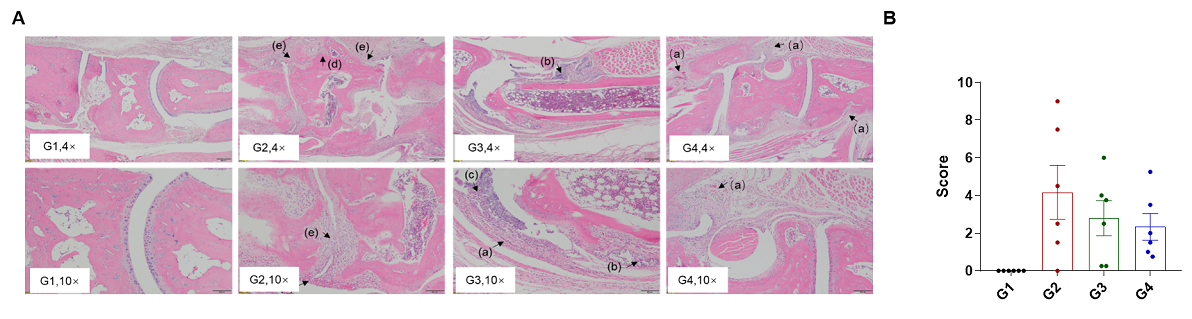
Efficacy of anti-human IL6 antibody in B-hIL6/hIL6R mice with collagen induced arthritis (CIA) model. Histopathological examination was performed on the joints of the extremities at endpoint. (A) Hematoxylin and eosin (H&E) staining. (B) Score of arthritis histology. G1 showed no significant abnormal changes. G2 showed bone structure damage(d), articular cavity or periarticular space disappeared (e), and pannus were observed (a), suggesting that the CIA model was successfully established. Compared with the G2 group, the low-dose group (G3) showed slight inflammatory cell infiltration (b) and pannus (a) and synovial hyperplasia (c). However, in the high dose group (G4), there was only partial pannus, the arthrosis disappeared and the articular cavity was obvious.
