
BALB/cCrSlcNifdc-Pdcd1tm1(PDCD1)BcgenCd274tm1(CD274)Bcgen/Bcgen • 112489
| Product name | B-hPD-1/hPD-L1 mice(C) |
|---|---|
| Catalog number | 112489 |
| Strain name | BALB/cCrSlcNifdc-Pdcd1tm1(PDCD1)BcgenCd274tm1(CD274)Bcgen/Bcgen |
| Strain background | BALB/cCrSlcNifdc |
| Aliases | Pdcd1: Ly101, PD-1, Pdc1 Cd274: A530045L16Rik, B7h1, Pdcd1l1, Pdcd1lg1, Pdl1 |
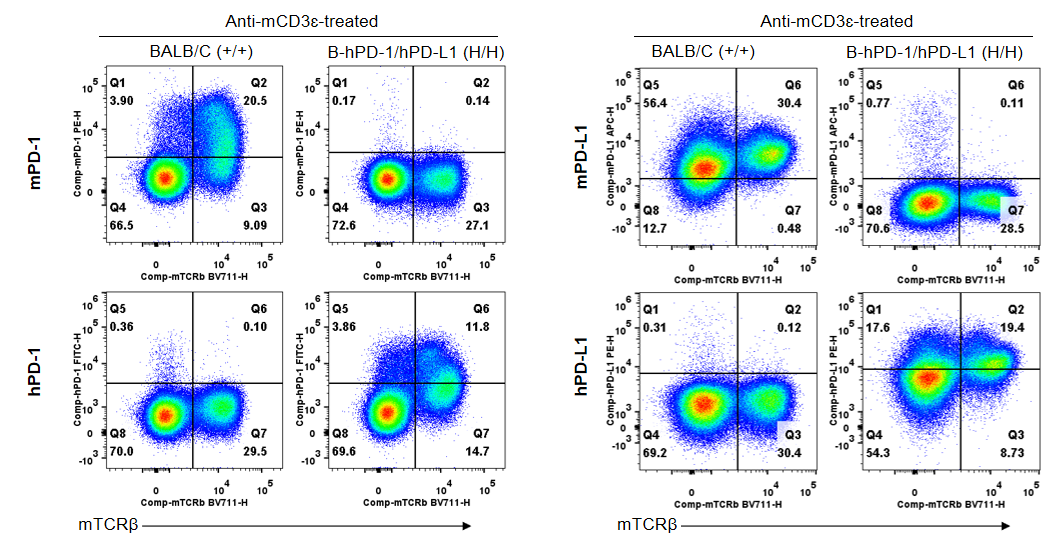
Strain specific PD-1 and PD-L1 expression analysis in wild-type BALB/c mice and homozygous B-hPD-1/hPD-L1 mice(C) by flow cytometry. Splenocytes were collected from wild-type BALB/c mice (+/+) and homozygous B-hPD-1/hPD-L1 mice(C) (H/H) stimulated with anti-mCD3ɛ in vivo. Mouse PD-1 and PD-L1 were only detectable in wild-type BALB/c mice. Human PD-1 and PD-L1 were only detectable in homozygous B-hPD-1/hPD-L1 mice(C), but not in wild-type BALB/c mice.
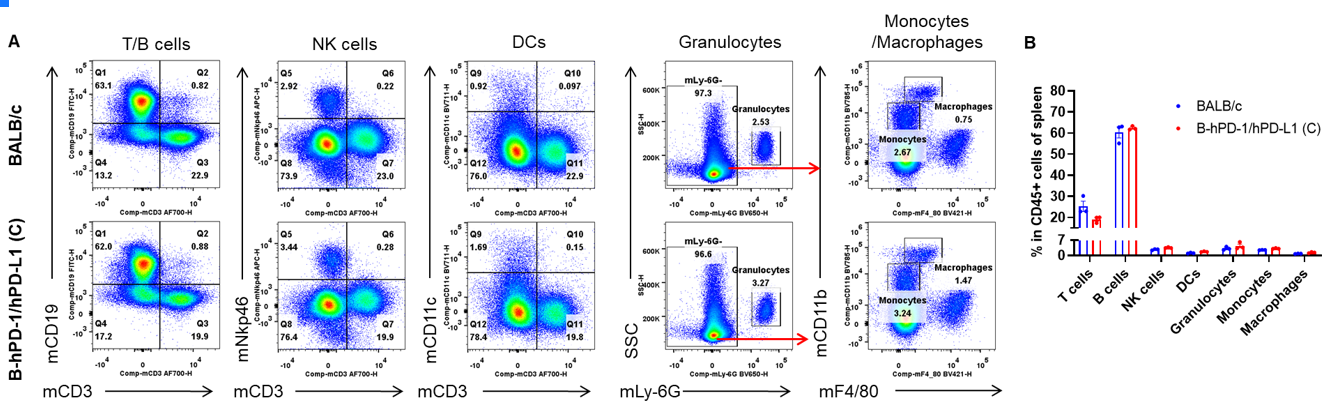
Analysis of the spleen leukocyte subpopulations by flow cytometry. Splenocytes were isolated from female BALB/c and homozygous B-hPD-1/hPD-L1 mice(C) (n=3, 7-week-old). Flow cytometry analysis of the splenocytes was performed to assess leukocyte subpopulations. A. Representative FACS plots. Single live cells were gated for the CD45+ population and used for further analysis as indicated. B. Results of FACS analysis. The percentages of T cells, B cells, NK cells, DCs, granulocytes, monocytes, and macrophages in homozygous B-hPD-1/hPD-L1 mice(C) were similar to those in the BALB/c mice. Values are expressed as mean ± SEM.
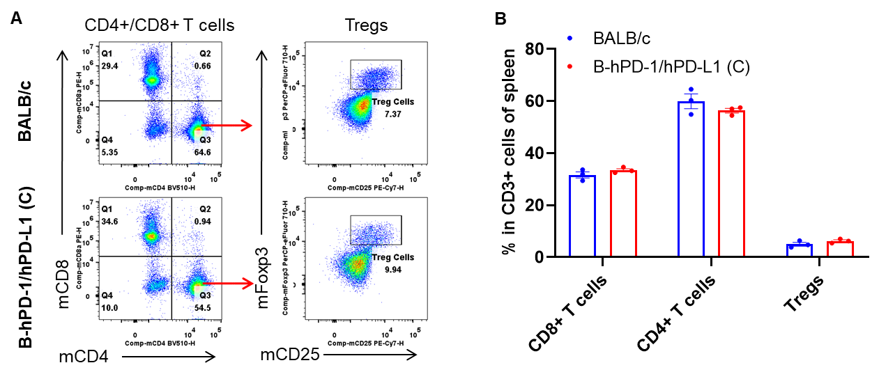
Analysis of the spleen T cell subpopulations by flow cytometry. Splenocytes were isolated from female BALB/c and homozygous B-hPD-1/hPD-L1 mice(C) (n=3, 7-week-old). Flow cytometry analysis of the splenocytes was performed to assess leukocyte subpopulations. A. Representative FACS plots. Single live CD45+ cells were gated for CD3+ T cell population and used for further analysis as indicated. B. Results of FACS analysis. The percentages of CD8+ T cells, CD4+ T cells, and Tregs in homozygous B-hPD-1/hPD-L1 mice(C) was similar to those in the BALB/c mice, demonstrating that introduction of hPD-1/hPD-L1 in place of its murine counterparts does not change the overall development, differentiation or distribution of these T cell subtypes in the spleen. Values are expressed as mean ± SEM.
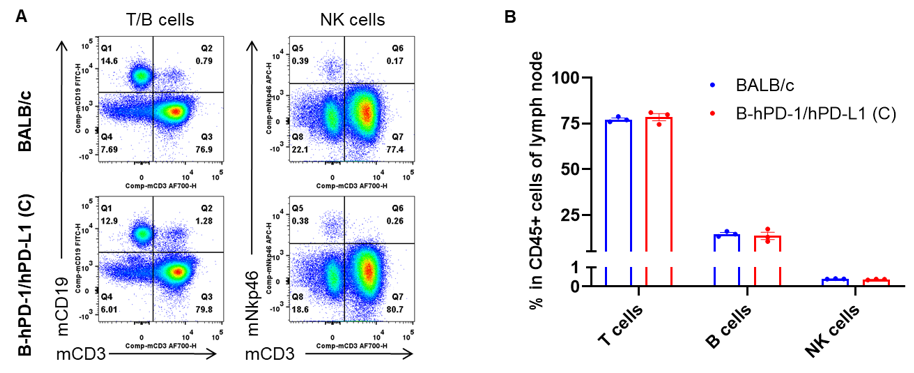
Analysis of the lymph node leukocyte subpopulations by flow cytometry. Leukocytes were isolated from female BALB/c and B-hPD-1/hPD-L1 mice(C) (n=3, 7- week-old) lymph nodes. Flow cytometry analysis of the leukocytes was performed to assess leukocyte subpopulations. A. Representative FACS plots. Single live cells were gated for CD45+ population and used for further analysis as indicated. B. Results of FACS analysis. The percentages of T cells, B cells, and NK cells in homozygous B-hPD-1/hPD-L1 mice(C) were similar to those in the BALB/c mice, demonstrating that introduction of hPD-1/hPD-L1 in place of its murine counterparts does not change the overall development, differentiation or distribution of these cell types in the lymph node. Values are expressed as mean ± SEM.
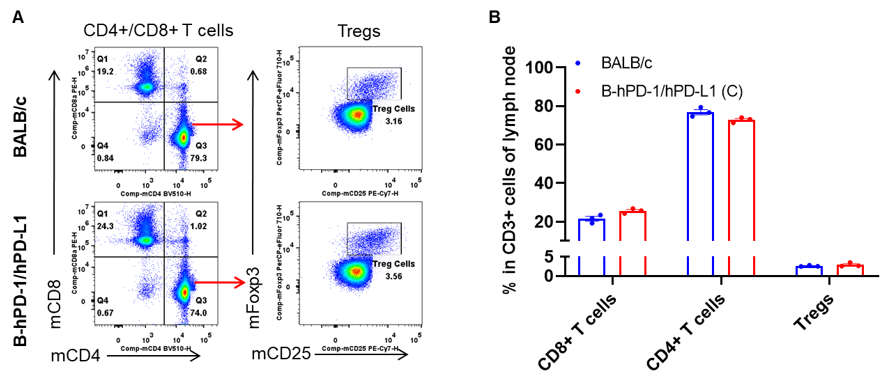
Analysis of the lymph node T cell subpopulations by flow cytometry. Lymph nodes were isolated from female BALB/c and homozygous B-hPD-1/hPD-L1 mice(C) (n=3, 7-week-old). Flow cytometry analysis of the leukocytes was performed to assess leukocyte subpopulations. A. Representative FACS plots. Single live CD45+ cells were gated for CD3+ T cell population and used for further analysis as indicated here. B. Results of FACS analysis. The percentages of CD4+ T, CD8+ T cells, and Tregs in homozygous B-hPD-1/hPD-L1 mice(C) were similar to those in the BALB/c mice, demonstrating that introduction of hPD-1/hPD-L1 in place of its murine counterparts does not change the overall development, differentiation or distribution of these T cell subtypes in the lymph node. Values are expressed as mean ± SEM.
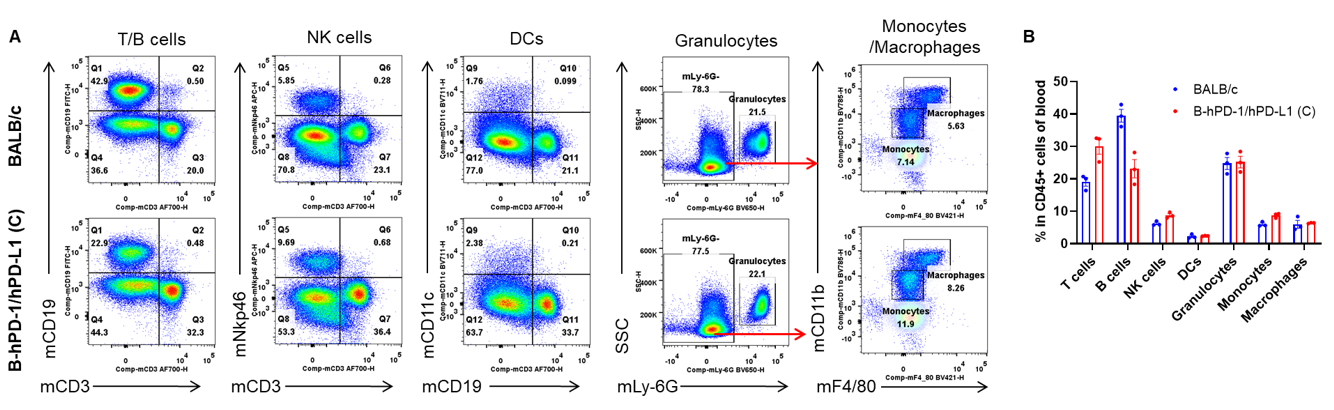
Analysis of the blood leukocyte subpopulations by flow cytometry. Blood cells were isolated from female BALB/c and homozygous B-hPD-1/hPD-L1 mice(C) (n=3, 7-week-old). Flow cytometry analysis of the blood was performed to assess leukocyte subpopulations. A. Representative FACS plots. Single live cells were gated for the CD45+ population and used for further analysis as indicated here. B. Results of FACS analysis. The percentages of T cells, B cells, NK cells, dendritic cells, granulocytes, monocytes, and macrophages in homozygous B-hPD-1/hPD-L1 mice(C) were similar to those in the BALB/c mice, demonstrating that hPD-1/hPD-L1 humanized does not change the overall development, differentiation or distribution of these cell types in the blood. Values are expressed as mean ± SEM.
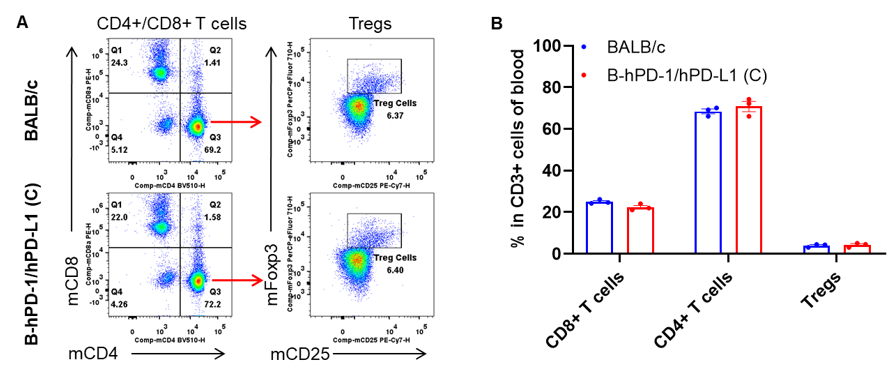
Analysis of the blood T cell subpopulations by flow cytometry. Blood cells were isolated from female BALB/c and homozygous B-hPD-1/hPD-L1 mice(C) (n=3, 7-week-old). Flow cytometry analysis of the leukocytes was performed to assess leukocyte subpopulations. A. Representative FACS plots. Single live CD45+ cells were gated for CD3+ T cell population and used for further analysis as indicated. B. Results of FACS analysis. The percentages of CD4+ T, CD8+ T cells, and Tregs in homozygous B-hPD-1/hPD-L1 mice(C) were similar to those in the BALB/c mice, demonstrating that introduction of hPD-1/hPD-L1 in place of its murine counterparts does not change the overall development, differentiation or distribution of these T cell subtypes in the blood. Values are expressed as mean ± SEM.
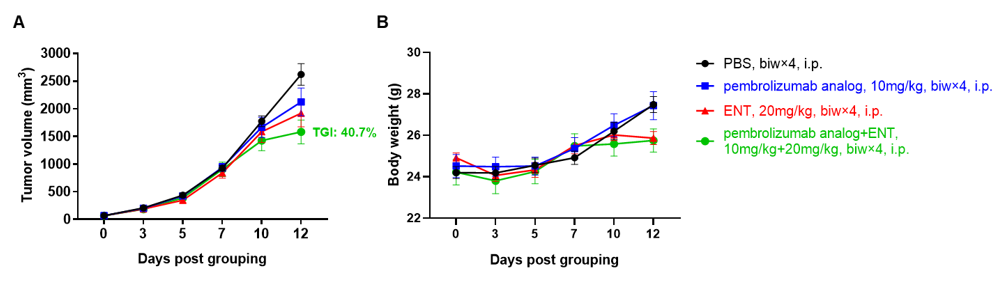
Antitumor activity of combination of pembrolizumab analog (in house) and entinostat (ENT) in B-hPD-1/hPD-L1 mice(C). (A) Combination of pembrolizumab analog and ENT inhibited B-hPD-L1 CT26.WT tumor growth in B-hPD-1/hPD-L1 mice(C). Murine colon cancer B-hPD-L1 CT26.WT cells were subcutaneously implanted into homozygous B-hPD-1/hPD-L1 mice(C) (female, 7-week-old, n=6). Mice were grouped when tumor volume reached approximately 60-80 mm3, at which time they were treated with pembrolizumab analog and ENT with doses indicated in panel. (B) Body weight changes during treatment. As shown in panel A, combination of pembrolizumab analog and ENT was efficacious in controlling tumor growth in B-hPD-1/hPD-L1 mice(C), demonstrating that the B-hPD-1/hPD-L1 mice(C) provide a powerful preclinical model for in vivo evaluation of anti-human PD-1 antibodies and tumor microenvironment inhibitors. Values are expressed as mean ± SEM.