

C57BL/6-Pdcd1tm1(PDCD1)BcgenCd274tm1(CD274)Bcgen,Tg(RP11-634C1)1Bcgen/Bcgen • 111954
| Product name | B-hPD-1/hPD-L1, Tg(hLILRB2/hLILRB3) mice |
|---|---|
| Catalog number | 111954 |
| Strain name | C57BL/6-Pdcd1tm1(PDCD1)BcgenCd274tm1(CD274)Bcgen,Tg(RP11-634C1)1Bcgen/Bcgen |
| Strain background | C57BL/6 |
| Aliases | PD-1 (Programmed death-1) ;CD274 (CD274 antigen);LILRB2(ILT4, LIR2, CD85D, ILT-4, LIR-2, MIR10, MIR-10);LILRB3(HL9, ILT5, LIR3, PIRB, CD85A, ILT-5, LIR-3, PIR-B, LILRA6); |
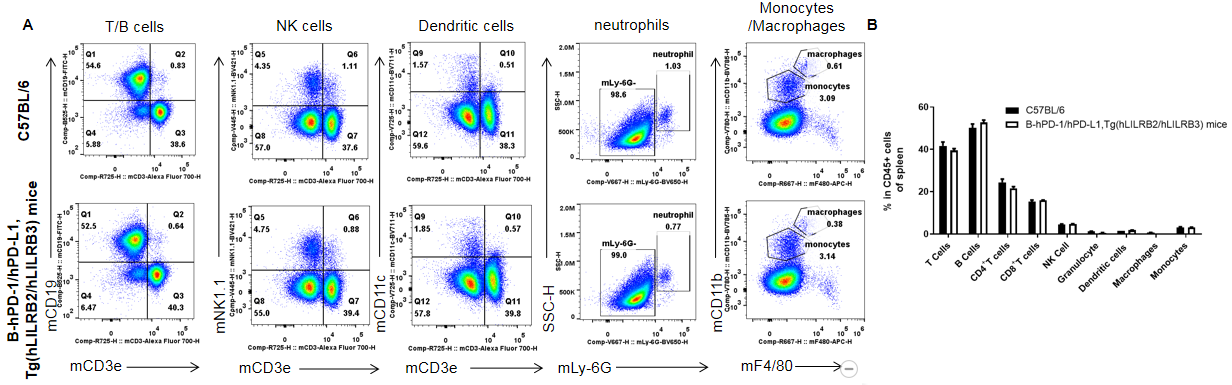
Analysis of spleen leukocyte subpopulations by FACS. Splenocytes were isolated from female C57BL/6 and B-hPD-1/hPD-L1, Tg(hLILRB2/hLILRB3) mice(n=3, 7-week-old). Flow cytometry analysis of the splenocytes was performed to assess leukocyte subpopulations. A. Representative FACS plots. Single live cells were gated for the CD45+ population and used for further analysis as indicated. B. Results of FACS analysis. The percentages of T cells, B cells, NK cells, dendritic cells, neutrophils, monocytes, and macrophages in B-hPD-1/hPD-L1,Tg(hLILRB2/hLILRB3) mice were similar to those in the C57BL/6 mice. Values are expressed as mean ± SEM.
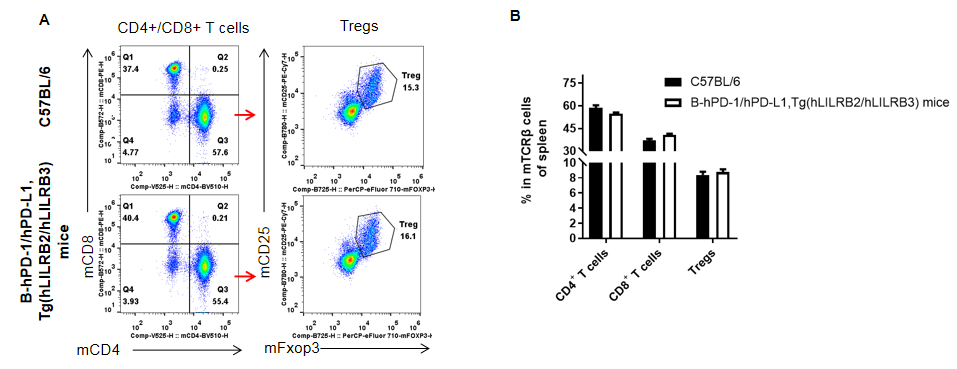
Analysis of spleen T cell subpopulations by FACS. Splenocytes were isolated from female C57BL/6 and B-hPD-1/hPD-L1, Tg(hLILRB2/hLILRB3) mice(n=3, 7-week-old). Flow cytometry analysis of the splenocytes was performed to assess leukocyte subpopulations. A. Representative FACS plots. Single live CD45+ cells were gated for TCRβ+ T cell population and used for further analysis as indicated. B. Results of FACS analysis. The percentages of CD8+ T cells, CD4+ T cells, and Tregs in B-hPD-1/hPD-L1,Tg(hLILRB2/hLILRB3) mice were similar to those in the C57BL/6 mice. Values are expressed as mean ± SEM.
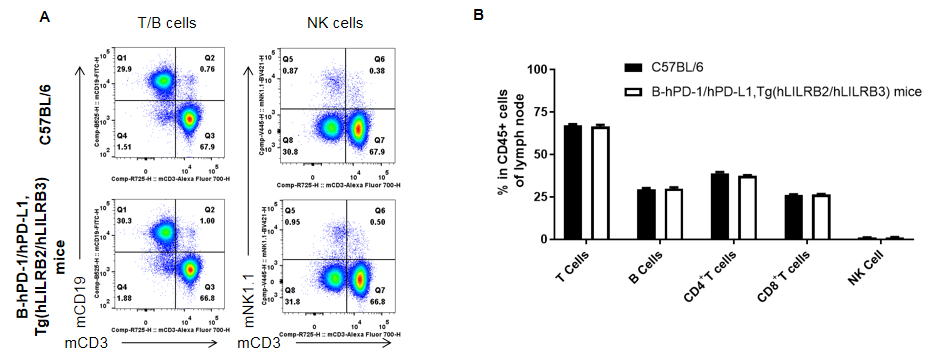
Analysis of lymph node leukocyte subpopulations by FACS. Leukocytes were isolated from female C57BL/6 and B-hPD-1/hPD-L1, Tg(hLILRB2/hLILRB3) mice(n=3, 7-week-old). Flow cytometry analysis of the leukocytes was performed to assess leukocyte subpopulations. A. Representative FACS plots. Single live cells were gated for CD45+ population and used for further analysis as indicated. B. Results of FACS analysis. The percentages of T cells, B cells, and NK cells in B-hPD-1/hPD-L1,Tg(hLILRB2/hLILRB3) mice were similar to those in the C57BL/6 mice. Values are expressed as mean ± SEM.
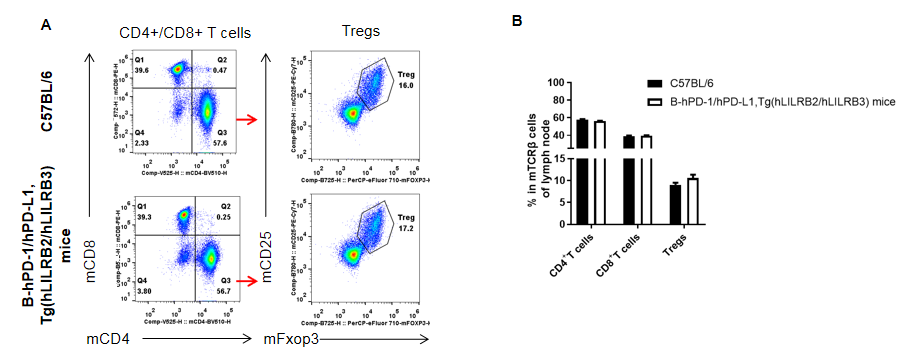
Analysis of lymph node T cell subpopulations by FACS. Leukocytes were isolated from female C57BL/6 and B-hPD-1/hPD-L1, Tg(hLILRB2/hLILRB3) mice(n=3, 7-week-old). Flow cytometry analysis of the leukocytes was performed to assess leukocyte subpopulations. A. Representative FACS plots. Single live CD45+ cells were gated for TCRβ+ T cell population and used for further analysis as indicated. B. Results of FACS analysis. The percentages of CD8+ T cells, CD4+ T cells, and Tregs in B-hPD-1/hPD-L1,Tg(hLILRB2/hLILRB3) mice were similar to those in the C57BL/6 mice. Values are expressed as mean ± SEM.
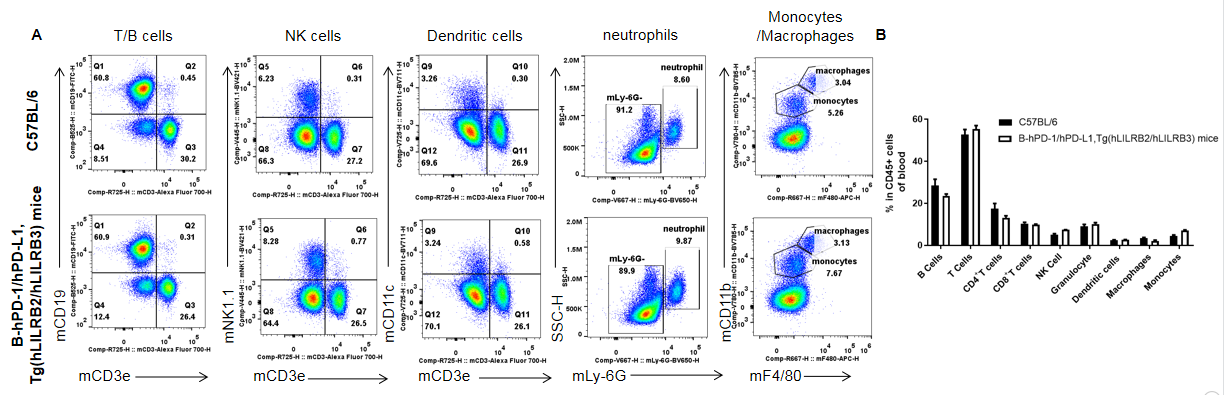
Analysis of blood leukocyte subpopulations by FACS. Leukocytes were isolated from female C57BL/6 and B-hPD-1/hPD-L1,Tg(hLILRB2/hLILRB3) mice(n=3, 7-week-old). Flow cytometry analysis of the blood was performed to assess leukocyte subpopulations. A. Representative FACS plots. Single live cells were gated for the CD45+ population and used for further analysis as indicated here. B. Results of FACS analysis. The percentages of T cells, B cells, NK cells, dendritic cells, neutrophils, monocytes, and macrophages in B-hPD-1/hPD-L1,,Tg(hLILRB2/hLILRB3) mice were similar to those in the C57BL/6 mice. Values are expressed as mean ± SEM.
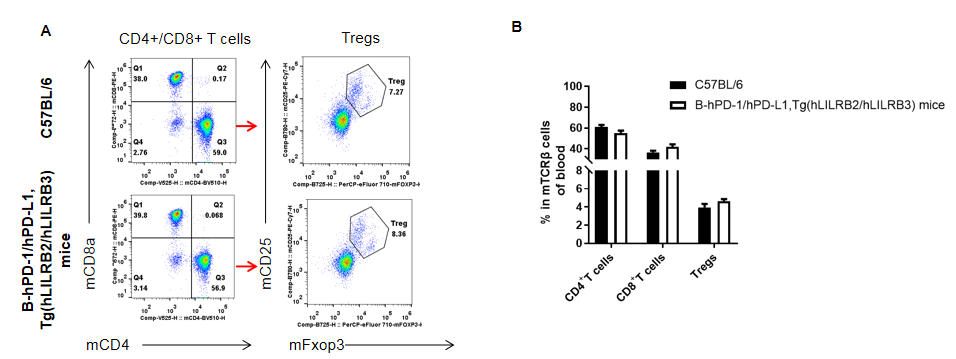
Analysis of blood T cell subpopulations by FACS. Leukocytes were isolated from female C57BL/6 and B-hPD-1/hPD-L1, Tg(hLILRB2/hLILRB3) mice(n=3, 7-week-old). Flow cytometry analysis of the blood was performed to assess leukocyte subpopulations. A. Representative FACS plots. Single live CD45+ cells were gated for TCRβ+ T cell population and used for further analysis as indicated. B. Results of FACS analysis. The percentages of CD8+ T cells, CD4+ T cells, and Tregs in B-hPD-1/hPD-L1,Tg(hLILRB2/hLILRB3) mice were similar to those in the C57BL/6 mice. Values are expressed as mean ± SEM.
