

C57BL/6-Tnfsf11tm1(TNFSF11)Bcgen/Bcgen • 111072
| Product name | B-hRANKL mice |
|---|---|
| Catalog number | 111072 |
| Strain name | C57BL/6-Tnfsf11tm1(TNFSF11)Bcgen/Bcgen |
| Strain background | C57BL/6 |
| NCBI gene ID | 21943 |
| Aliases | CD254, ODF, OPGL, OPTB2, RANKL, TNLG6B, TRANCE, hRANKL2, sOdf |
Gene targeting strategy for B-hRANKL mice. The exons 4~5 of mouse Rankl gene that encode the extracellular region were replaced with human RANKL exons 4~5 in B-hRANKL mice.
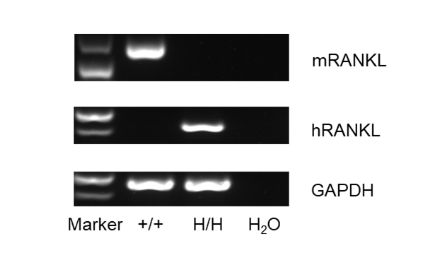
Strain specific analysis of RANKL gene expression in wild-type C57BL/6 mice and B-hRANKL mice by RT-PCR. Mouse Rankl mRNA was detectable only in thymocytes of wild-type C57BL/6 mice (+/+). Human RANKL mRNA was detectable only in homozygous B-hRANKL mice but not in wild-type mice.
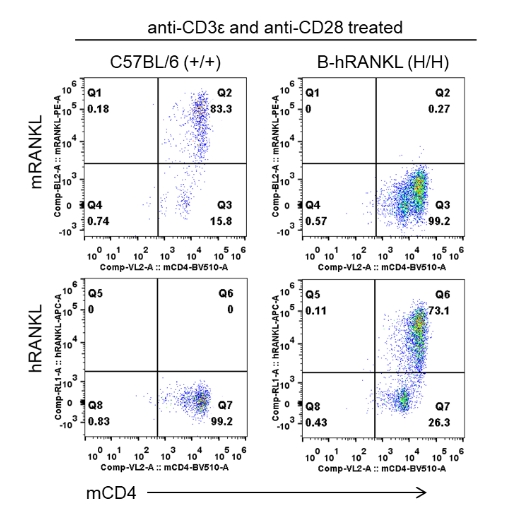
Strain specific RANKL expression analysis in wild-type C57BL/6 mice and homozygous B-hRANKL mice by flow cytometry. CD4+ T cells were isolated from the spleen of wild-type C57BL/6 mice (+/+) and homozygous B-hRANKL mice (H/H) stimulated with anti-mCD3e and anti-mCD28 antibodies in vitro. Mouse RANKL was detectable only in wild-type C57BL/6 mice. Human RANKL was exclusively detectable in homozygous B-hRANKL mice.
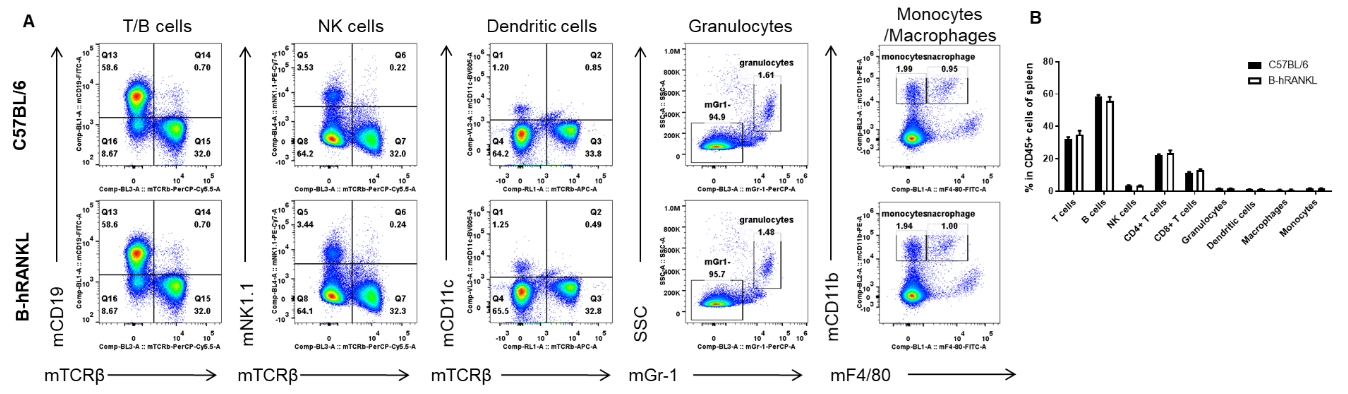
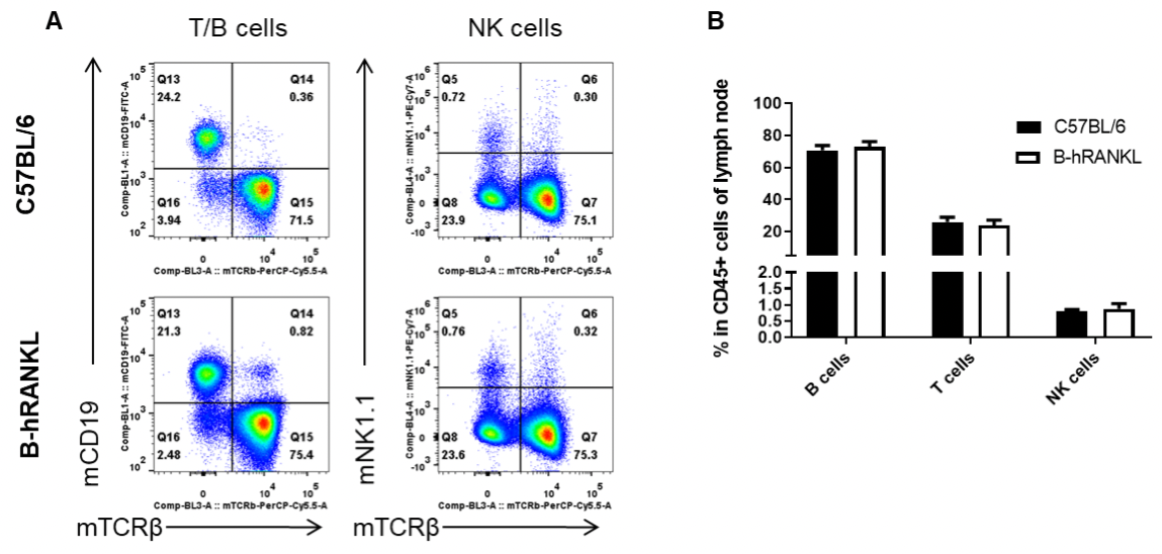
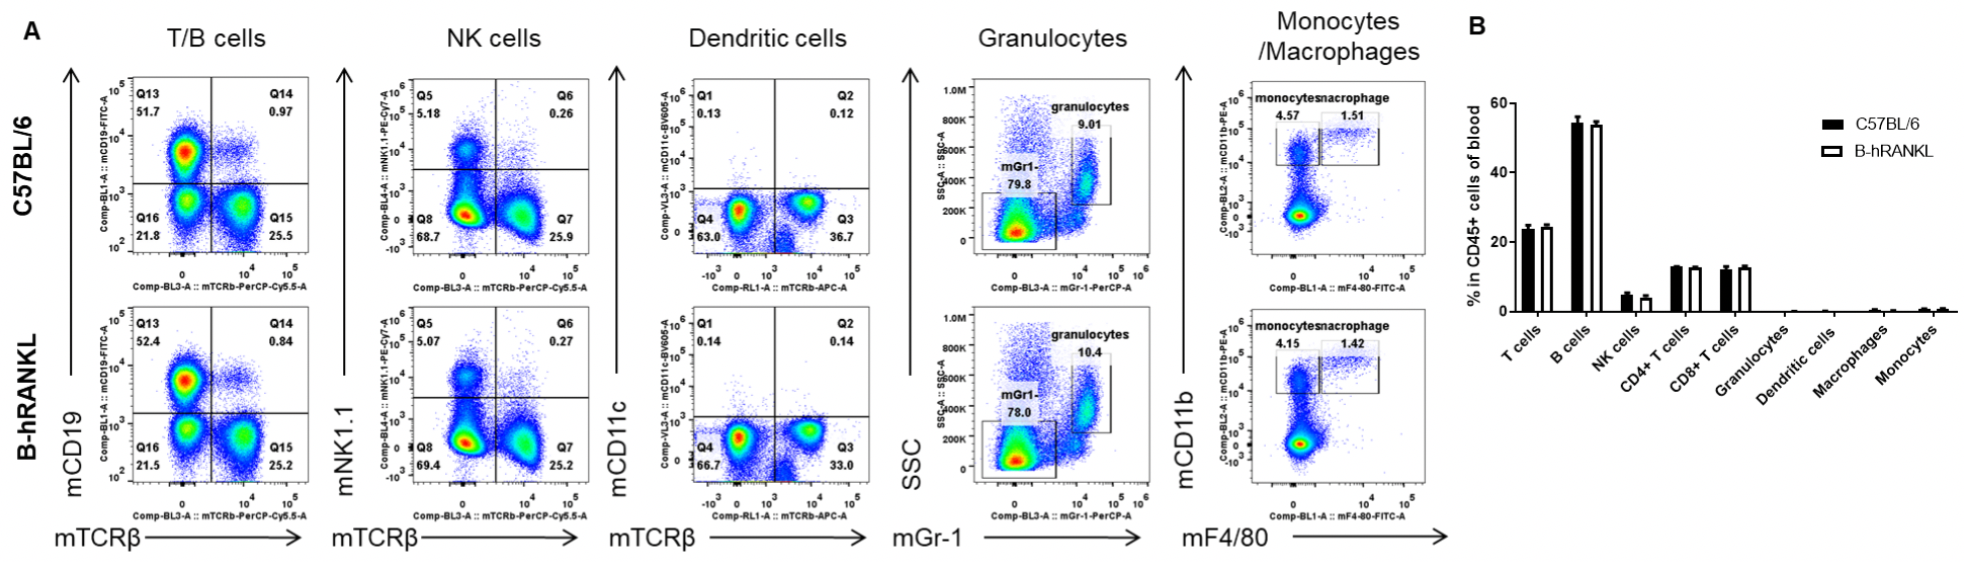
Analysis of spleen leukocyte subpopulations by FACS. Splenocytes were isolated from female C57BL/6 and B-hRANKL mice (n=3, 6-week-old). Flow cytometry analysis of the splenocytes was performed to assess leukocyte subpopulations. A. Representative FACS plots. Single live cells were gated for the CD45+ population and used for further analysis as indicated here. B. Results of FACS analysis. Percent of T cells, B cells, NK cells, dendritic cells, granulocytes, monocytes and macrophages in homozygous B-hRANKL mice were similar to those in the C57BL/6 mice, demonstrating that introduction of hRANKL in place of its mouse counterpart does not change the overall development, differentiation or distribution of these T cell subtypes in spleen. Values are expressed as mean ± SEM.
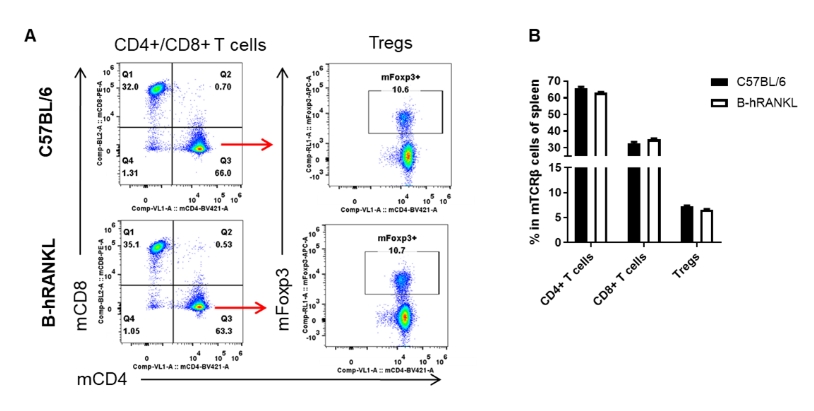
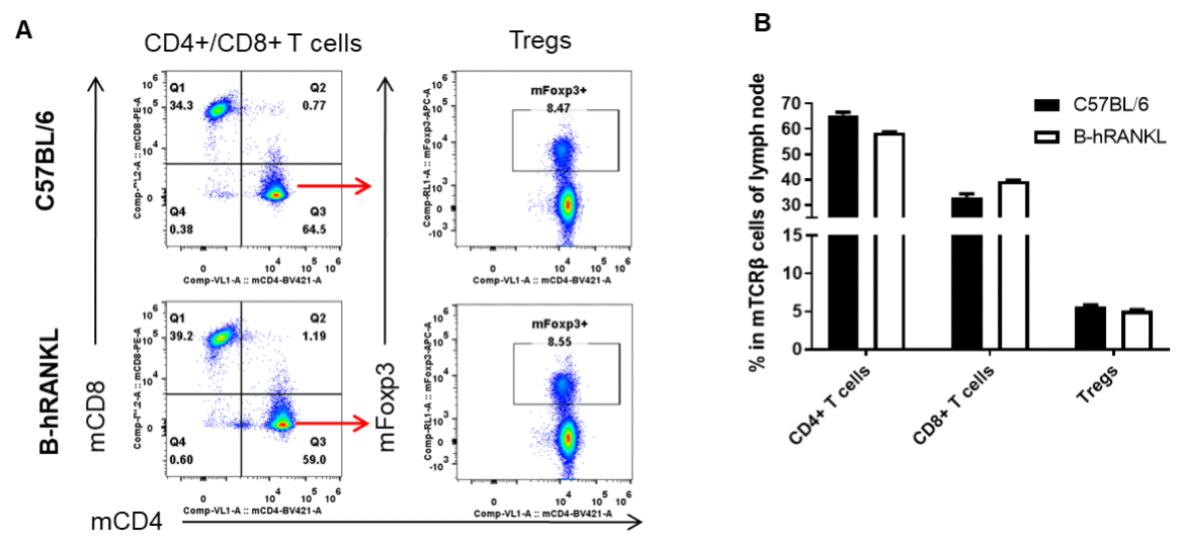
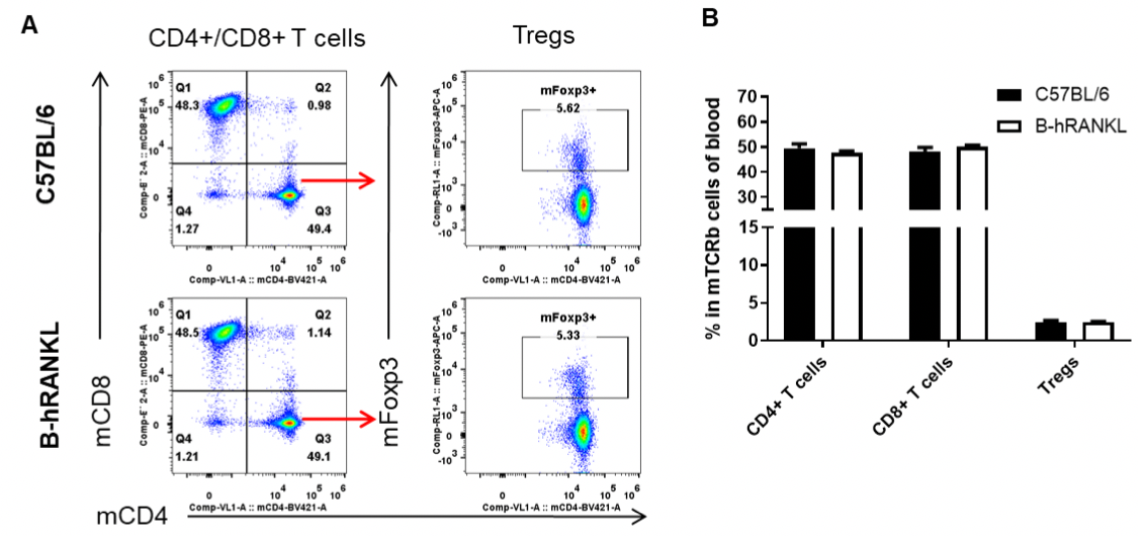
Analysis of spleen T cell subpopulations by FACS. Splenocytes were isolated from female C57BL/6 and B-hRANKL mice (n=3, 6-week-old). Flow cytometry analysis of the splenocytes was performed to assess leukocyte subpopulations. A. Representative FACS plots. Single live CD45+ cells were gated for TCRβ+ T cell population and used for further analysis as indicated here. B. Results of FACS analysis. The percent of CD4+ T cells, CD8+ T cells and Tregs in homozygous B-hRANKL mice were similar to those in the C57BL/6 mice, demonstrating that introduction of hRANKL in place of its mouse counterpart does not change the overall development, differentiation or distribution of these T cell subtypes in spleen. Values are expressed as mean ± SEM.

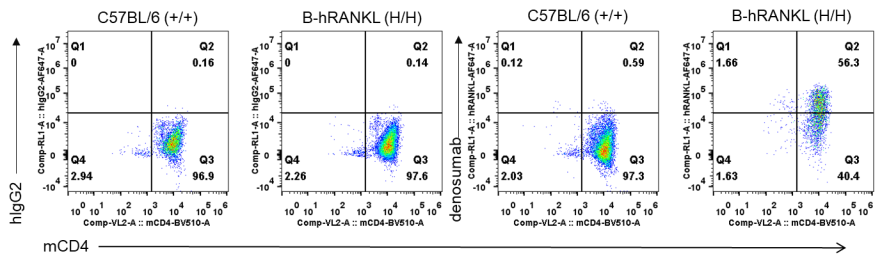
Antibody binding analysis of B-hRANKL mice by FACS. CD4+ T cells were collected from wild-type C57BL/6 mice (+/+) and homozygous B-hRANKL mice (H/H). Single live cells were gated for CD4+ population and used for further analysis. Anti-hRANKL antibody denosumab (in house) can bind CD4+ T cells of B-hRANKL mice, but not bind the cells of wild-type C57BL/6 mice.
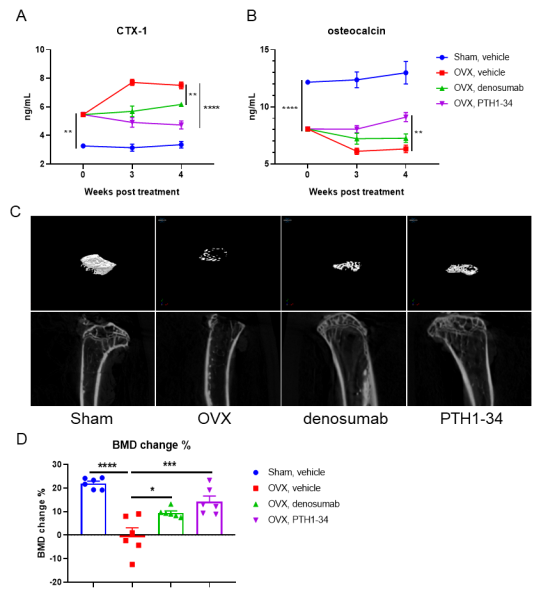
The use of an anti-human RANKL antibody denosumab (in house) in an osteoporosis mouse model in B-RANKL mice was effective in improving several key measures of osteoporosis. Mice were first randomly separated to receive ovariectomy or sham surgery. The ovariectomized mice were then randomly divided into 3 treatment groups (OVX, Denosumab and PTH1-34) at 4 weeks after surgery (n = 6). Mice were sacrificed at 4 weeks after treatment. Serum was obtained 3 times before and after treatment for analysis of C terminal telopeptide of type 1 collagen (CTX-1) and osteocalcin (OC). The time points of serum collection were shown in figure A. The proximal tibia were harvested for analysis of bone mineral density (BMD) by μCT. A-B. The concentration of serum bone resorption marker CTX-1 and serum bone formation marker OC. C. Representative micro-CT images of the proximal tibia in each group. D. The BMD change of the proximal tibia. Results showed that compared with the sham group without surgery, the concentration of bone resorption marker CTX-1 was significantly increased, while the concentration of bone formation marker OC and BMD change of proximal tibia were significantly decreased in the OVX group, indicating that the osteoporosis mouse model was successfully modeled with B-hRANKL mice. After treatment with anti-human RANKL antibody or PTH, the concentration of CTX-1 was significantly decreased, while the concentration of OC and the percentage change of BDM were significantly increased compared with the untreated OVX group. These results indicated that the anti-human RANKL antibody could effectively treat osteoporosis in B-hRANK mice. The B-hRANKL mice provide a powerful preclinical mouse model for in vivo evaluating efficacy of anti-human RANKL antibodies. Values are expressed as mean ± SEM.
