C57BL/6N-Tpbgtm1(TPBG)Bcgen/Bcgen • 111048
| Product name | B-hTPBG mice |
|---|---|
| Catalog number | 111048 |
| Strain name | C57BL/6N-Tpbgtm1(TPBG)Bcgen/Bcgen |
| Strain background | C57BL/6N |
| NCBI gene ID | 21983 |
| Aliases | TPBG (Trophoblast glycoprotein), 5T4 |
Gene targeting strategy for B-hTPBG mice. The exon 2 of mouse Tpbg gene that encodes the full-length protein was replaced by human TPBG exon 2 in B-hTPBG mice.
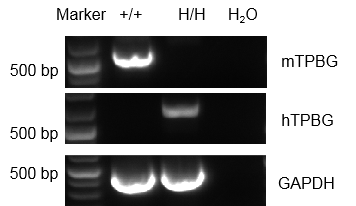
Strain specific analysis of TPBG gene expression in wild-type and B-hTPBG mice by RT-PCR. Mouse Tpbg mRNA was detectable in splenocytes of wild-type mice (+/+). Human TPBG mRNA was detectable only in homozygous B-hTPBG mice (H/H), but not in wild-type mice.
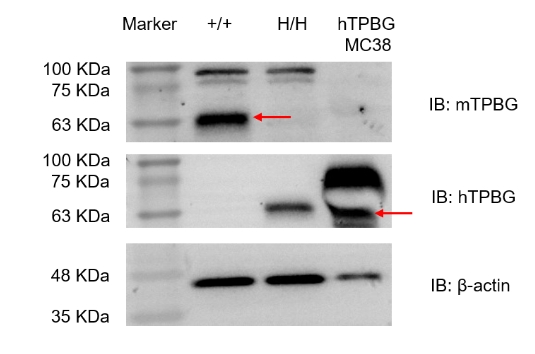
Strain specific analysis of TPBG expression in WT and B-hTPBG mice by western blot. Spine were collected from WT mice and homozygous B-hTPBG mice (H/H). Mouse TPBG was detectable in WT mice, the observed band size 63 kDa (red arrow indicating) is the target band. Human TPBG was exclusively detectable in homozygous B-hTPBG and hTPBG overexpressed MC38 cells but not in WT mice.
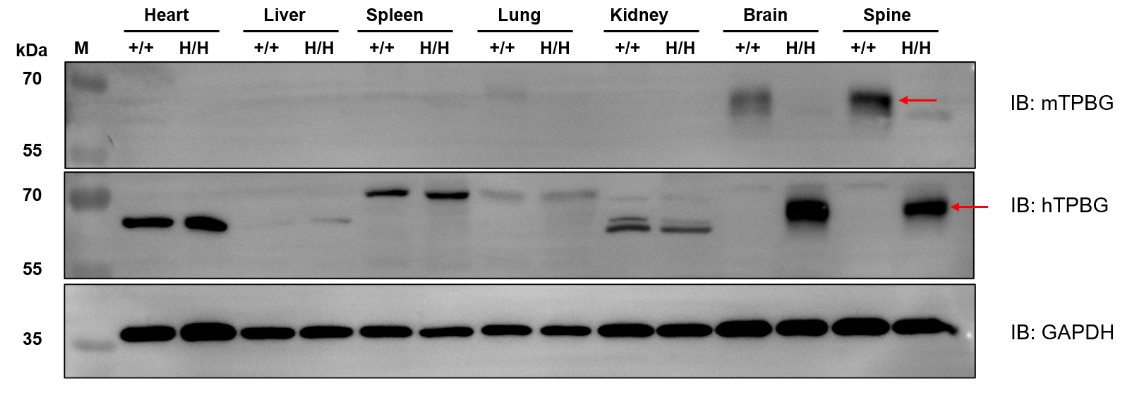
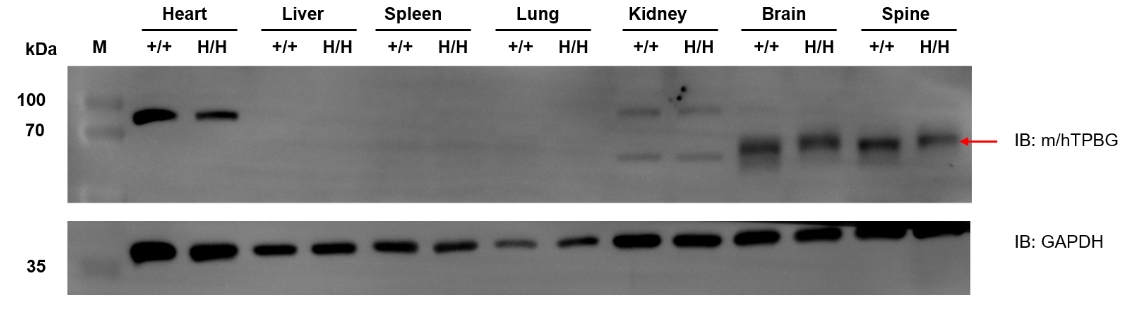
Strain specific analysis of TPBG expression in wild-type mice and B-hTPBG mice by western blot. Tissues in the panel were collected from wild-type mice (+/+) and homozygous B-hTPBG mice (H/H), and analyzed by western blot with species-specific antibodies. Mouse TPBG was detectable in the brain and spine of wild-type mice. Human TPBG was exclusively detectable in the brain and spine of homozygous B-hTPBG mice.
Strain specific analysis of TPBG expression in wild-type mice and B-hTPBG mice by western blot. Tissues in the panel were collected from wild-type mice (+/+) and homozygous B-hTPBG mice (H/H), and analyzed by western blot with species cross-reactive antibody. TPBG was both detectable in the brain and spine of wild-type mice and homozygous B-hTPBG mice.
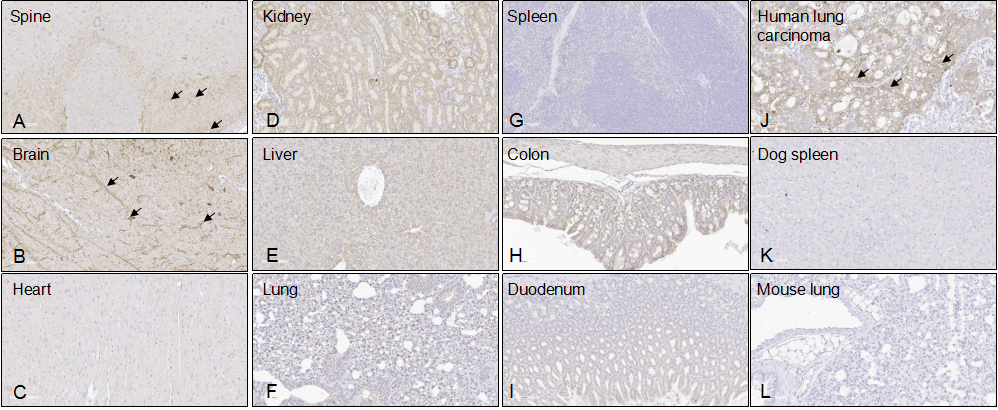
Representative human TPBG expression in different tissues of B-hTPBG mice by IHC. Tissues were stained with antibodies specific for human TPBG (A-K) or anti-IgG antibody (L). Brain and spine of B-hTPBG mice show human TPBG positive. Human TPBG + cells were located in the white matter region of the spinal cord and the cortex region of the brain tissue, respectively. Human lung carcinoma as a positive control (J); Dog spleen was a negative control (K); Mouse lung tissues from the wild-type C57BL/6 mice (L).Other tissues were got from homozygous B-hTPBG mice (A-I). Original magnification ×200. Abbreviations: IHC, immunohistochemistry.
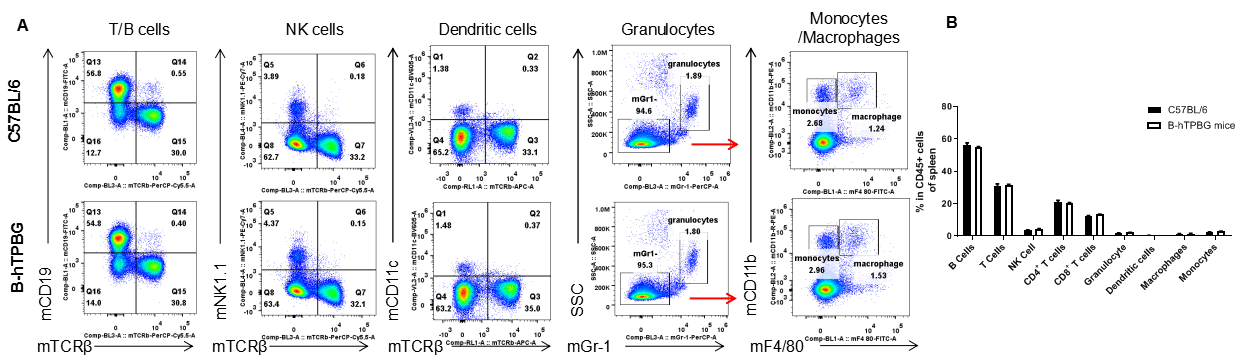
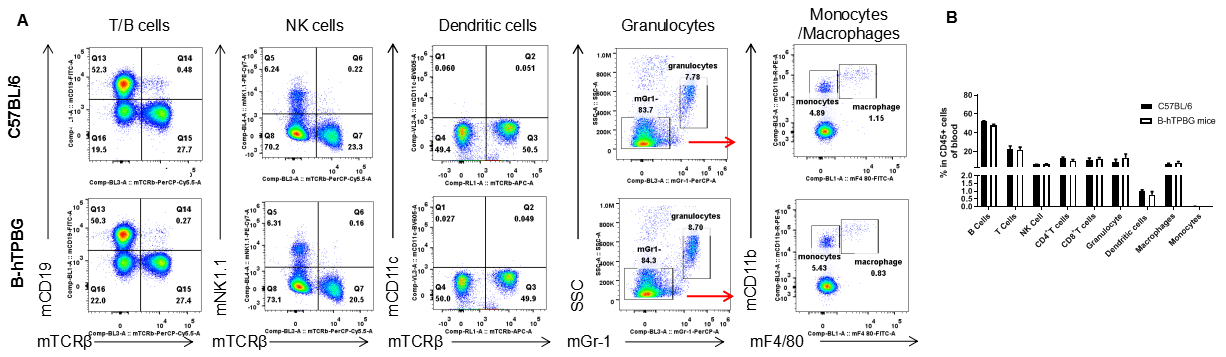
Analysis of spleen leukocyte subpopulations by FACS. Splenocytes were isolated from female C57BL/6 and B-hTPBG mice (n=3, 6-week-old). Flow cytometry analysis of the splenocytes was performed to assess leukocyte subpopulations. A. Representative FACS plots. Single live cells were gated for the CD45+ population and used for further analysis as indicated here. B. Results of FACS analysis. Percent of T cells, B cells, NK cells, dendritic cells, granulocytes, monocytes and macrophages in homozygous B-hTPBG mice were similar to those in the C57BL/6 mice, demonstrating that TPBG humanized does not change the overall development, differentiation or distribution of these cell types in spleen. Values are expressed as mean ± SEM.
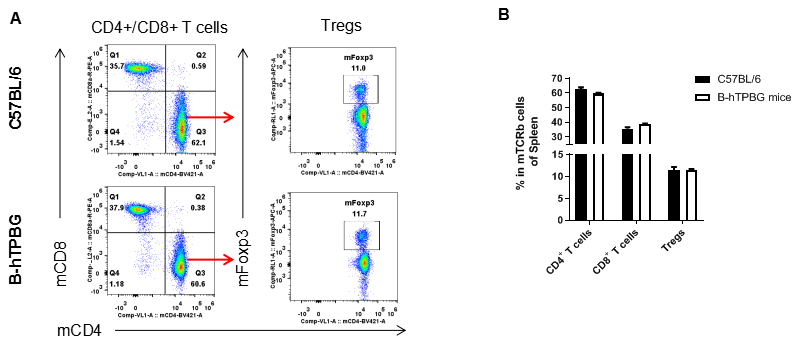
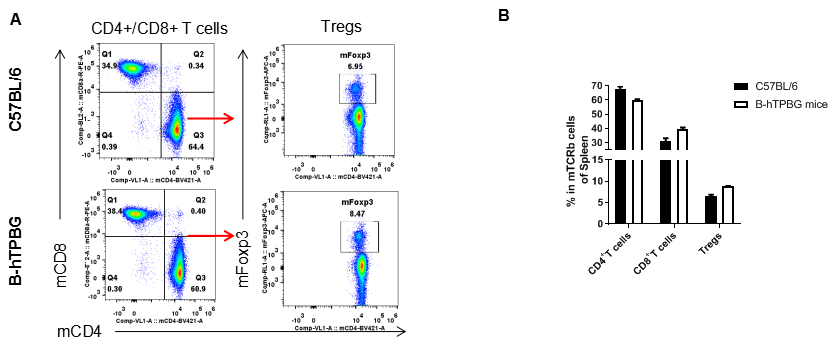
Analysis of spleen T cell subpopulations by FACS. Splenocytes were isolated from female C57BL/6 and B-hTPBG mice (n=3, 6-week-old). Flow cytometry analysis of the splenocytes was performed to assess leukocyte subpopulations. A. Representative FACS plots. Single live CD45+ cells were gated for TCRβ+T cell population and used for further analysis as indicated here. B. Results of FACS analysis. The percent of CD8+ T cells, CD4+ T cells, and Tregs in homozygous B-hTPBG mice were similar to those in the C57BL/6 mice, demonstrating that introduction of hTPBG in place of its mouse counterpart does not change the overall development, differentiation or distribution of these T cell subtypes in spleen. Values are expressed as mean ± SEM.
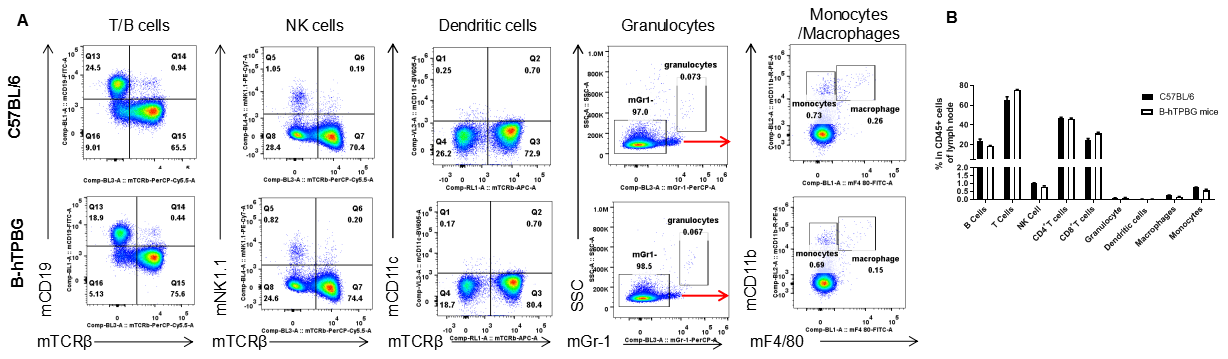
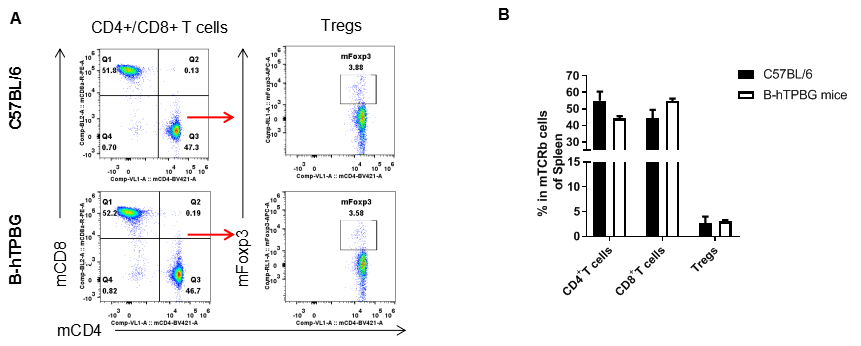
Analysis of lymph node leukocyte subpopulations by FACS. Lymph node was isolated from female C57BL/6 and B-hTPBG mice (n=3, 6-week-old). Flow cytometry analysis of the lymph node was performed to assess leukocyte subpopulations. A. Representative FACS plots. Single live cells were gated for the CD45+ population and used for further analysis as indicated here. B. Results of FACS analysis. Percent of T cells, B cells, NK cells, dendritic cells, granulocytes, monocytes and macrophages in homozygous B-hTPBG mice were similar to those in the C57BL/6 mice, demonstrating that TPBG humanized does not change the overall development, differentiation or distribution of these cell types in lymph node. Values are expressed as mean ± SEM.