 mRNA expression analysis
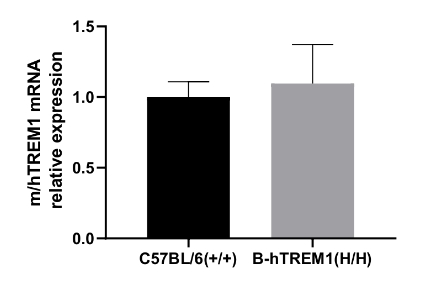
Strain specific analysis of TREM1 gene expression in wild type C57BL/6 (+/+) mice and homozygous B-hTREM1(H/H) mice by RT-qPCR. The mRNA expression of hTREM1 in B-hTREM1(H/H) was similar to mTrem1 in the C57BL/6 (+/+), demonstrating that introduction of hTREM1 in place of its mouse counterpart does not change the expression level of TREM1 mRNA.
Protein expression analysis
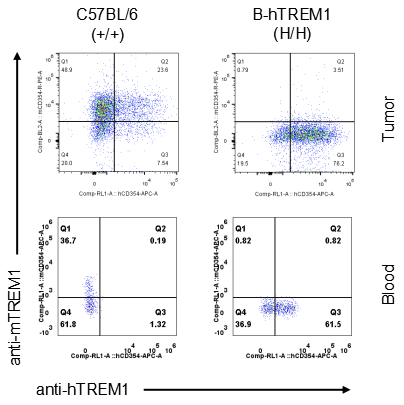
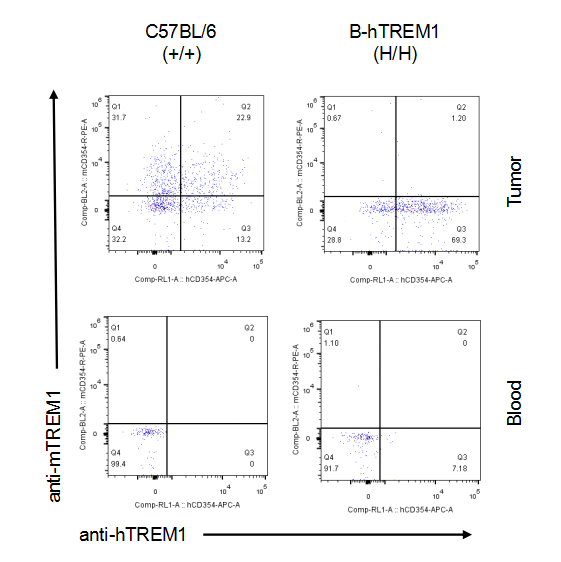
Strain specific TREM1 expression analysis in homozygous B-hTREM1 mice by flow cytometry.MC38 cells were inoculated into wild-type C57BL/6(+/+) and homozygous B-hTREM1 mice(H/H). Blood and tumor were harvested when tumor volume reached approximately 500 mm3, and analyzed by flow cytometry with species-specific anti-TREM1 antibody. Mouse TREM1 was exclusively detectable in blood and tumor macrophage of wild-type mice. Human TREM1 was exclusively detectable in blood and tumor macrophage of homozygous B-hTREM1 mice.* It is not clear what population of cells was stained with specific anti-hTREM1 in tumors of C57BL/6 (Q2).
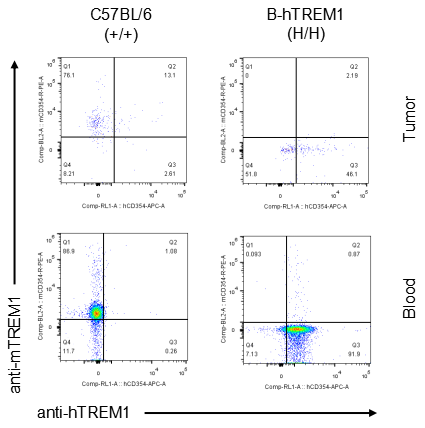
Strain specific TREM1 expression analysis in homozygous B-hTREM1 mice by flow cytometry.MC38 cells were inoculated into wild-type C57BL/6(+/+) and homozygous B-hTREM1 mice(H/H). Blood and tumor were harvested when tumor volume reached approximately 500 mm3, and analyzed by flow cytometry with species-specific anti-TREM1 antibody. Mouse and human TREM1 were not detectable in blood monocyte of wild-type mice and homozygous B-hTREM1 mice. Human TREM1 was exclusively detectable in tumor M-MDSC of homozygous B-hTREM1 mice.* It is not clear what population of cells was stained with specific anti-hTREM1 in tumors of C57BL/6 (Q2).
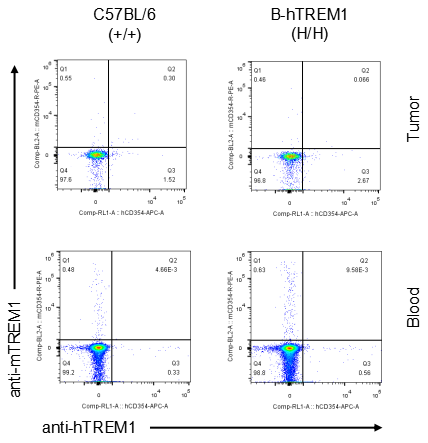
Strain specific TREM1 expression analysis in homozygous B-hTREM1 mice by flow cytometry.MC38 cells were inoculated into wild-type C57BL/6(+/+) and homozygous B-hTREM1 mice(H/H). Blood and tumor were harvested when tumor volume reached approximately 500 mm3, and analyzed by flow cytometry with species-specific anti-TREM1 antibody. Mouse TREM1 was exclusively detectable in blood and tumor neutrophil(G-MDSC) of wild-type mice. Human TREM1 was exclusively detectable in blood and tumor neutrophil(G-MDSC) of homozygous B-hTREM1 mice.
Strain specific TREM1 expression analysis in homozygous B-hTREM1 mice by flow cytometry.MC38 cells were inoculated into wild-type C57BL/6(+/+) and homozygous B-hTREM1 mice(H/H). Blood and tumor were harvested when tumor volume reached approximately 500 mm3, and analyzed by flow cytometry with species-specific anti-TREM1 antibody. Mouse and human TREM1 were not detectable in blood and tumor T cells of wild-type mice and homozygous B-hTREM1 mice.
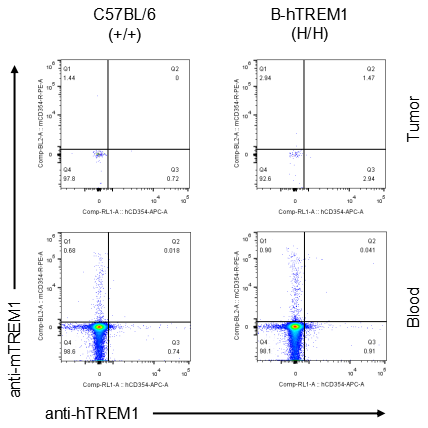
Strain specific TREM1 expression analysis in homozygous B-hTREM1 mice by flow cytometry.MC38 cells were inoculated into wild-type C57BL/6(+/+) and homozygous B-hTREM1 mice(H/H). Blood and tumor were harvested when tumor volume reached approximately 500 mm3, and analyzed by flow cytometry with species-specific anti-TREM1 antibody. Mouse and human TREM1 were not detectable in blood and tumor B cells of wild-type mice and homozygous B-hTREM1 mice.
Analysis of leukocytes cell subpopulation in spleen
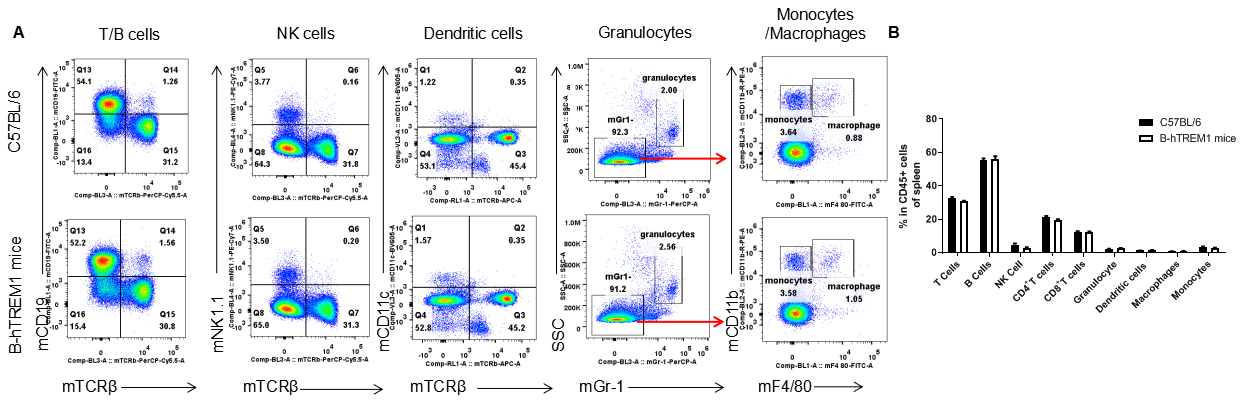
Analysis of spleen leukocyte subpopulations by FACS. Splenocytes were isolated from female C57BL/6 and B-hTREM1 mice (n=3, 6-week-old). Flow cytometry analysis of the splenocytes was performed to assess leukocyte subpopulations. A. Representative FACS plots. Single live cells were gated for the CD45+ population and used for further analysis as indicated here. B. Results of FACS analysis. Percent of T cell, B cell, NK cell, monocyte, dendritic cell, granulocyte and macrophage in homozygous B-hTREM1 mice were similar to those in the C57BL/6 mice, demonstrating that TREM1 humanized does not change the overall development, differentiation or distribution of these cell types in spleen. Values are expressed as mean ± SEM.
Analysis of T cell subpopulation in spleen
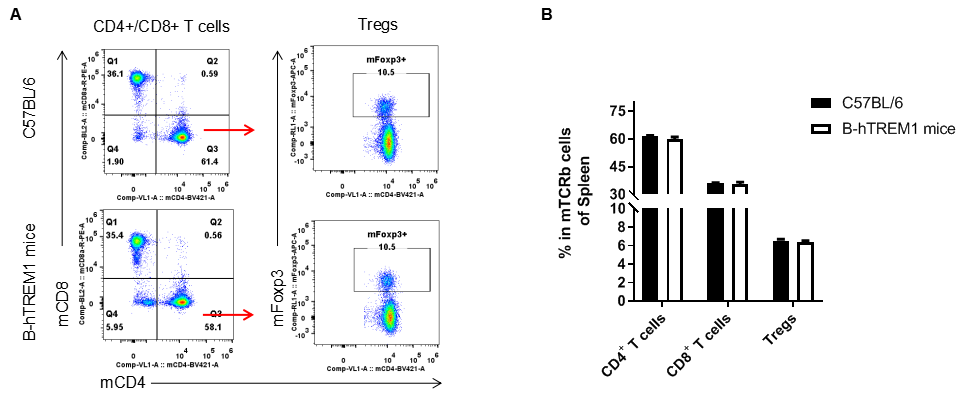
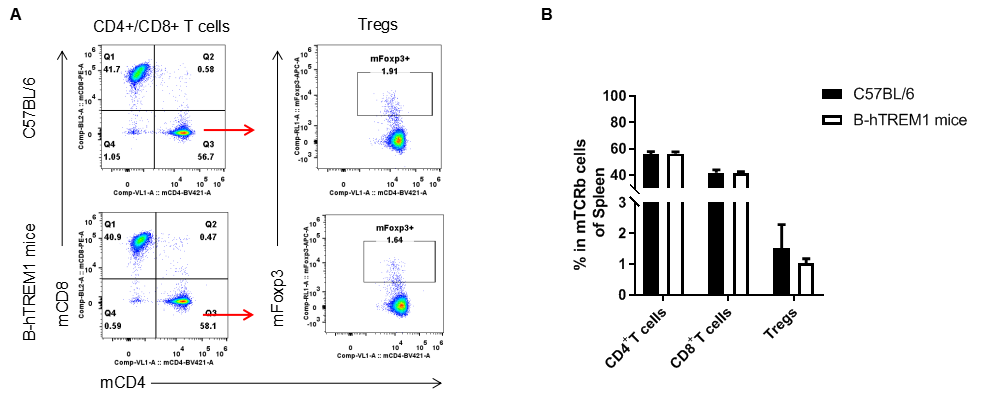
Analysis of spleen T cell subpopulations by FACS. Splenocytes were isolated from female C57BL/6 and B-hTREM1 mice (n=3, 6-week-old). Flow cytometry analysis of the splenocytes was performed to assess leukocyte subpopulations. A. Representative FACS plots. Single live CD45+ cells were gated for TCRβ+T cell population and used for further analysis as indicated here. B. Results of FACS analysis. There were no differences between C57BL/6 and B-hTREM1 mice, demonstrating that humanized of TREM1 does not change the overall development, differentiation or distribution of these T cell subtypes. Values are expressed as mean ± SEM.
Analysis of leukocytes cell subpopulation in LNs
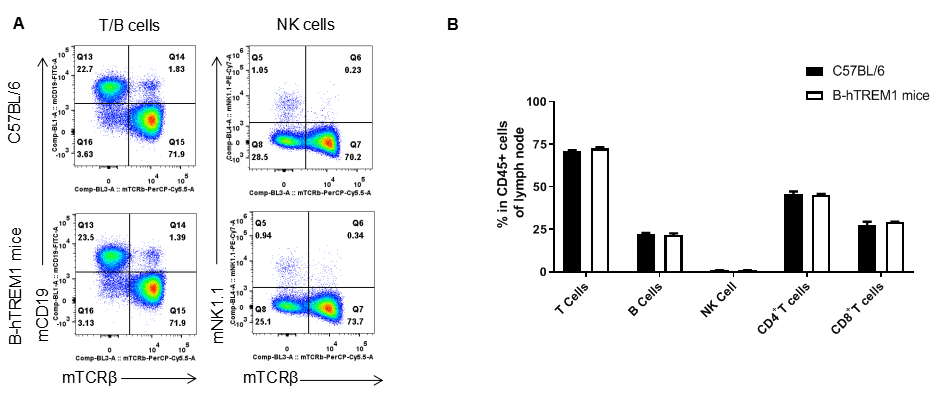
Analysis of LNs leukocyte subpopulations by FACS. LNs were isolated from female C57BL/6 and B-hTREM1 mice (n=3, 6-week-old). Flow cytometry analysis of the LNs was performed to assess leukocyte subpopulations. A. Representative FACS plots. Single live cells were gated for the CD45+ population and used for further analysis as indicated here. B. Results of FACS analysis. Percent of T cell, B cell, NK cell in homozygous B-hTREM1 mice were similar to those in the C57BL/6 mice, demonstrating that TREM1 humanized does not change the overall development, differentiation or distribution of these cell types in spleen. Values are expressed as mean ± SEM.
Analysis of T cell subpopulation in LNs
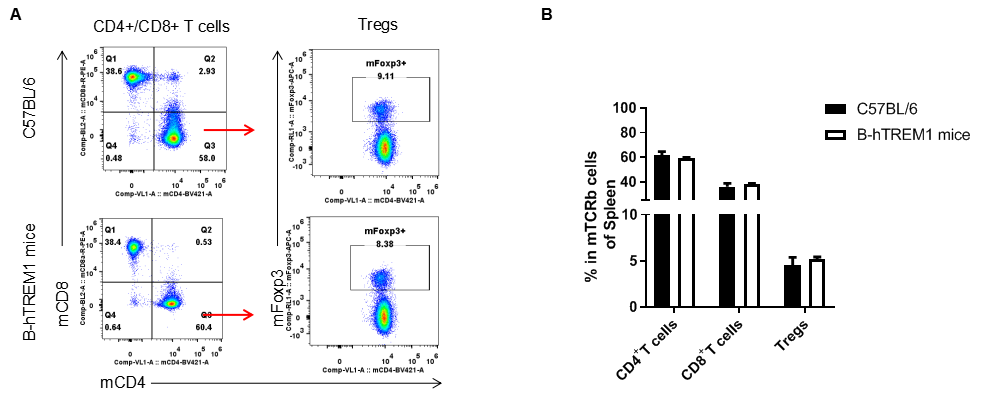
Analysis of LNs T cell subpopulations by FACS. LNs were isolated from female C57BL/6 and B-hTREM1 mice (n=3, 6-week-old). Flow cytometry analysis of the LNs was performed to assess leukocyte subpopulations. A. Representative FACS plots. Single live CD45+ cells were gated for TCRβ+T cell population and used for further analysis as indicated here. B. Results of FACS analysis. . There were no differences between C57BL/6 and B-hTREM1 mice, demonstrating that humanized of TREM1 does not change the overall development, differentiation or distribution of these T cell subtypes. Values are expressed as mean ± SEM.
Analysis of leukocytes cell subpopulation in blood
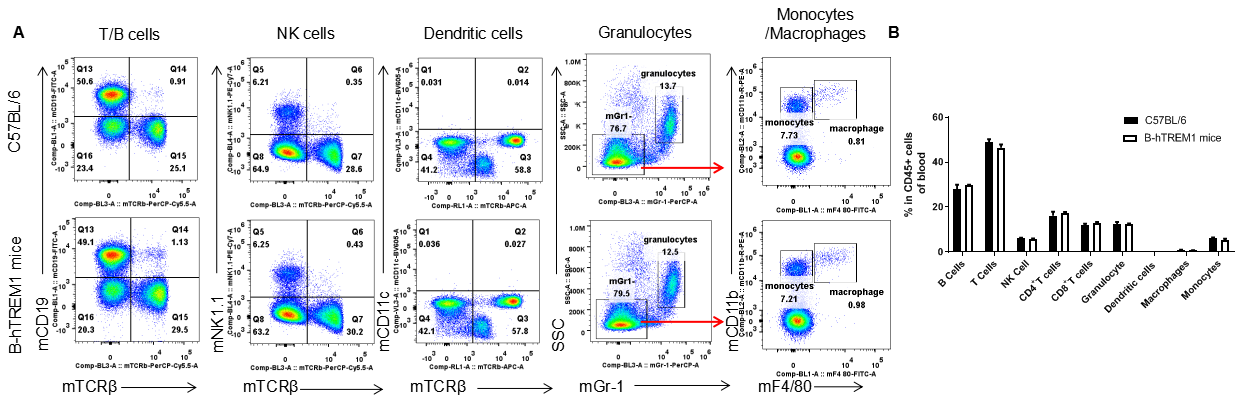
Analysis of blood leukocyte subpopulations by FACS. Blood were isolated from female C57BL/6 and B-hTREM1 mice (n=3, 6-week-old). Flow cytometry analysis of the blood was performed to assess leukocyte subpopulations. A. Representative FACS plots. Single live cells were gated for the CD45+ population and used for further analysis as indicated here. B. Results of FACS analysis. Percent of T cell, B cell, NK cell, monocyte, dendritic cell, granulocyte and macrophage in homozygous B-hTREM1 mice were similar to those in the C57BL/6 mice, demonstrating that TREM1 humanized does not change the overall development, differentiation or distribution of these cell types in blood. Values are expressed as mean ± SEM.
Analysis of T cell subpopulation in blood
Analysis of blood T cell subpopulations by FACS. Blood were isolated from female C57BL/6 and B-hTREM1 mice (n=3, 6-week-old). Flow cytometry analysis of the blood was performed to assess leukocyte subpopulations. A. Representative FACS plots. Single live CD45+ cells were gated for TCRβ+T cell population and used for further analysis as indicated here. B. Results of FACS analysis. There were no differences between C57BL/6 and B-hTREM1 mice, demonstrating that humanized of TREM1 does not change the overall development, differentiation or distribution of these T cell subtypes. Values are expressed as mean ± SEM.
Analysis of hTREM1 function in B-hTREM1 mice
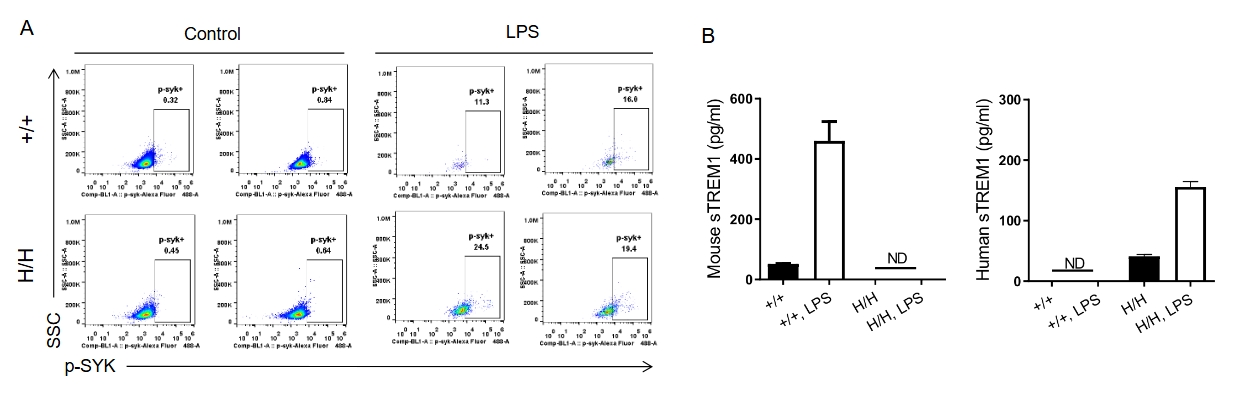
Analysis of the hTREM1 function in B-hTREM1 mice. Wild-type C57BL/6 mice(+/+) and B-hTREM1 mice(H/H) were randomly grouped and injected intraperitoneally (i.p.) with LPS from E.coli(500 ug/mouse). Serum and peritoneal macrophages were collected after LPS administration. Under LPS-stimulated conditions, human TREM1 could be activated effectively and then induced rapid phosphorylation of Syk in B-hTREM1 mice(A). Additionally, soluble TREM1 were upregulated in the serum of B-hTREM1 mice (B), indicating that mouse matrix metalloproteinase(MMP) was capable of proteolytically cleaving human TREM1, and inducing the release of soluble TREM1. ND, not detected.
 Tumor growth curve & Body weight changes
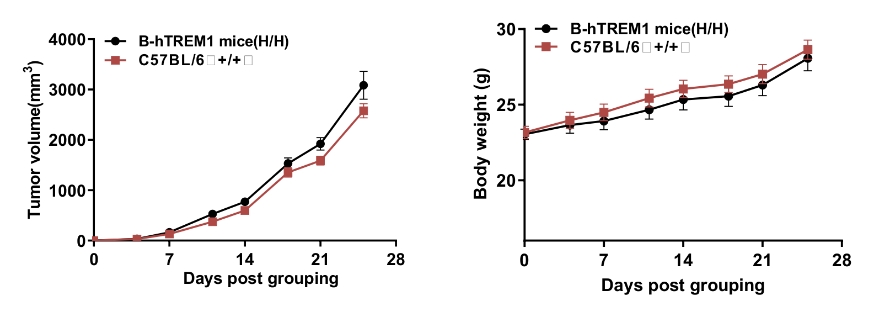
Subcutaneous homograft tumor growth of MC38 cells in B-hTREM1 mice. Wild-type MC38 cells (5x10⁵) were subcutaneously implanted into wild-type C57BL/6 mice and B-hTREM1 mice (male, 8-week-old, n=6). Tumor volume and body weight were measured twice a week. (A) Average tumor volume ± SEM. (B) Body weight (Mean ± SEM). Tumor volume was expressed in mm3 using the formula: V = 0.5 X long diameter X (short diameter)2. As shown in panel A, MC38 cells were able to establish tumors in B-hTREM1 mice and can be used for efficacy studies.
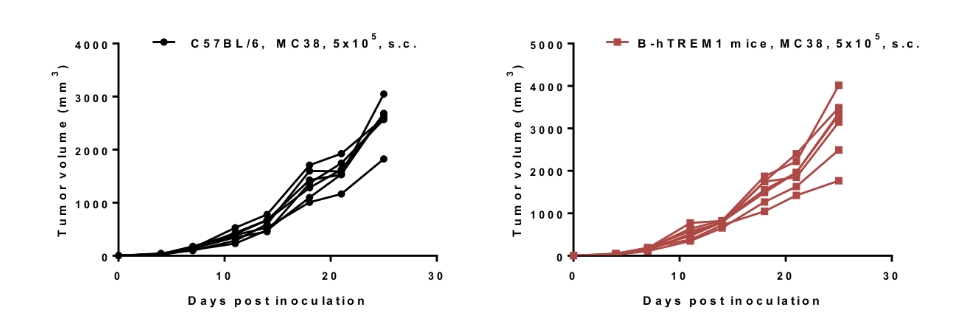
Tumor growth curve of individual mice
MC38 tumor cells growth of individual mice. Wild-type MC38 cells (5x10⁵) were subcutaneously implanted into wild-type C57BL/6 mice and B-hTREM1 mice (male, 8-week-old, n=6). As shown in the panel, B-hTREM1 mice were able to establish tumors in vivo and can be used for efficacy studies.
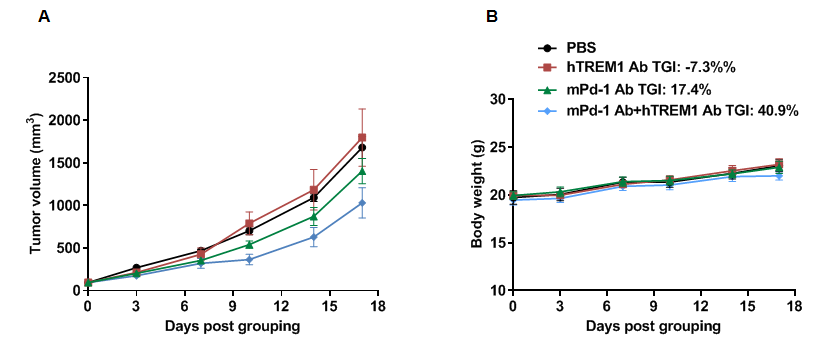
Combination therapy of anti-mouse PD-1 antibody and anti-human TREM1 antibody
Antitumor activity of anti-mouse PD-1 antibody combined with anti-human TREM1 antibody in B-hTREM1 mice. (A) Anti-mouse PD-1 antibody combined with anti-human TREM1 antibody inhibited MC38 tumor growth in B-hTREM1 mice. Murine colon cancer MC38 cells were subcutaneously implanted into homozygous B-hTREM1 mice (female, 9-week-old, n=5). Mice were grouped when tumor volume reached approximately 80-100 mm3, at which time they were treated with mPD-1 and hTREM1 antibodies. (B) Body weight changes during treatment. As shown in panel A, combination of anti-hTREM1 and anti-mPD-1 antibody shows more inhibitory effects than individual groups, demonstrating that the B-hTREM1 mice provide a powerful preclinical model for in vivo evaluation of anti-human TREM1 antibody. Values are expressed as mean ± SEM.