 Protein expression analysis
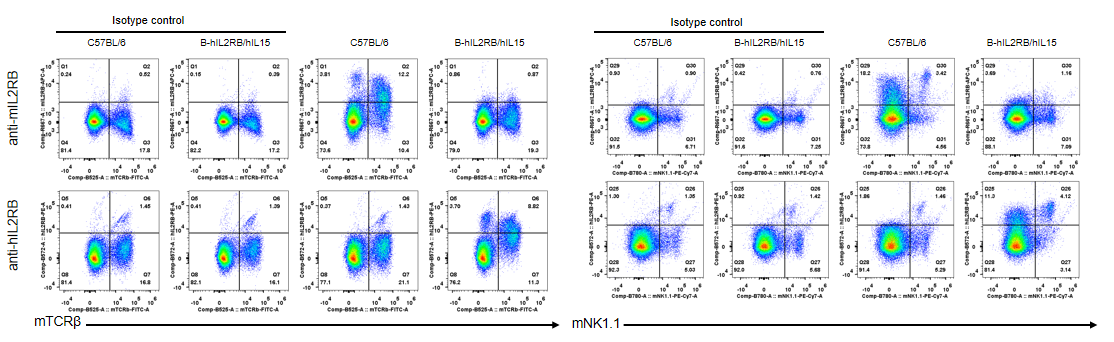
Strain specific IL2RB expression analysis in homozygous B-hIL2RB/hIL15 mice by flow cytometry. Splenocytes were collected from wild-type mice and B-hIL2RB/hIL15 mice that treated with anti-mCD3ε in vivo, and analyzed by flow cytometry with species-specific antibody. Human IL2RB was detectable in T cells and NK cells of homozygous B-hIL2RB/hIL15 mice.
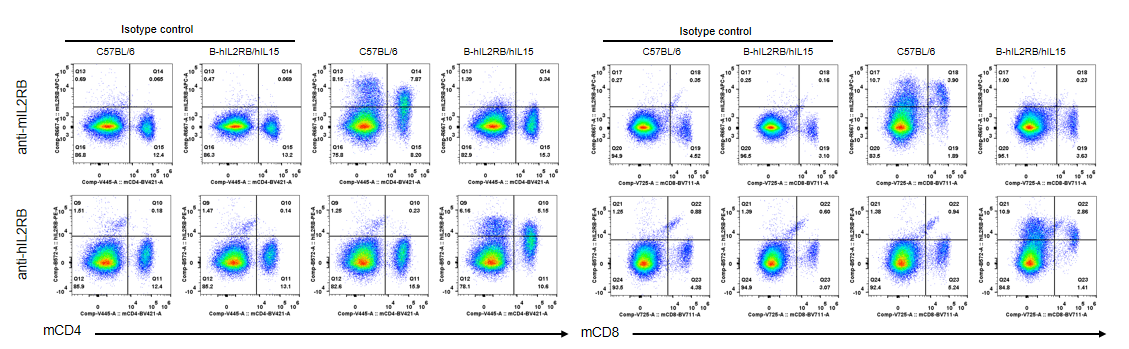
Strain specific IL2RB expression analysis in homozygous B-hIL2RB/hIL15 mice by flow cytometry. Splenocytes were collected from wild-type mice and B-hIL2RB/hIL15 mice that treated with anti-mCD3ε in vivo, and analyzed by flow cytometry with species-specific antibody. Human IL2RB was detectable in CD4+ T cells and CD8+ T cells of homozygous B-hIL2RB/hIL15 mice.
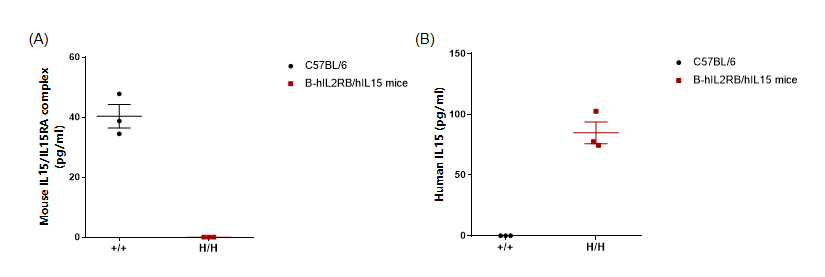
Strain specific IL15 expression analysis in homozygous B-hIL2RB/hIL15 mice by ELISA. Serum was collected from wild-type mice (+/+) and homozygous B-hIL15/hIL15RA mice (H/H), and analyzed by ELISA. Mouse IL15/IL15RA complex was only detectable in wild-type mice but not in homozygous B-hIL2RB/hIL15 mice (A). Human IL15 was exclusivley detectable in homozygous B-hIL2RB/hIL15 mice but not in wild-type mice (B).
Analysis of spleen leukocytes subpopulation
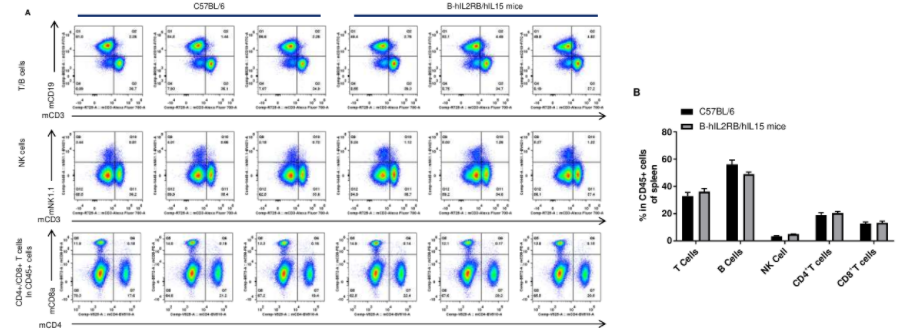
Analysis of spleen leukocyte subpopulations by FACS. Splenocytes were isolated from female C57BL/6 and B-hIL2RB/hIL15 mice (n=3, 7-week-old). Flow cytometry analysis of the splenocytes were performed to assess leukocyte subpopulations. A. Representative FACS plots. Single live cells were gated for the CD45+ population and used for further analysis as indicated here. B. Results of FACS analysis. Percent of T cells, B cells, NK cells, CD4+ T cells and CD8+ T cells in homozygous B-hIL2RB/hIL15 mice were similar to those in the C57BL/6 mice. Values are expressed as mean ± SEM.
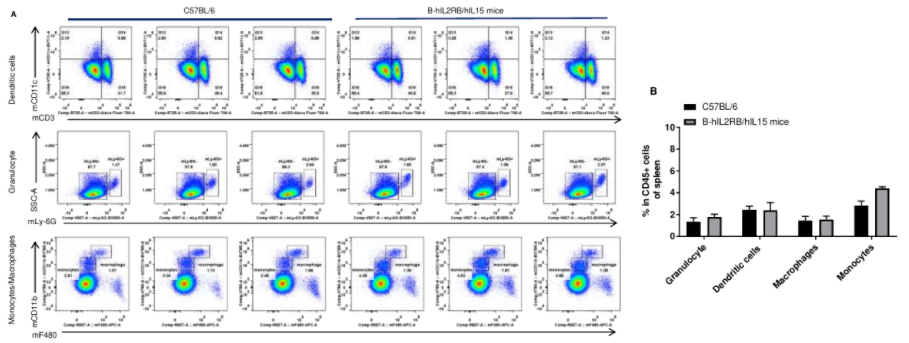
Analysis of spleen leukocyte subpopulations by FACS. A. Representative FACS plots. Single live cells were gated for the CD45+ population and used for further analysis as indicated here. B. Results of FACS analysis. Percent of monocytes, dendritic cells, granulocytes and macrophages in B-hIL2RB/hIL15 mice were similar to those in the C57BL/6 mice. Values are expressed as mean ± SEM.
Analysis of spleen T leukocytes subpopulation
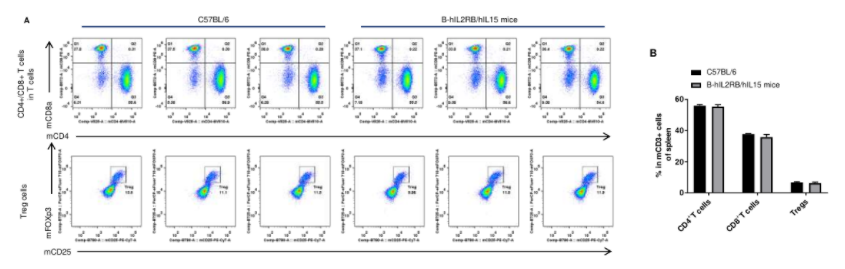
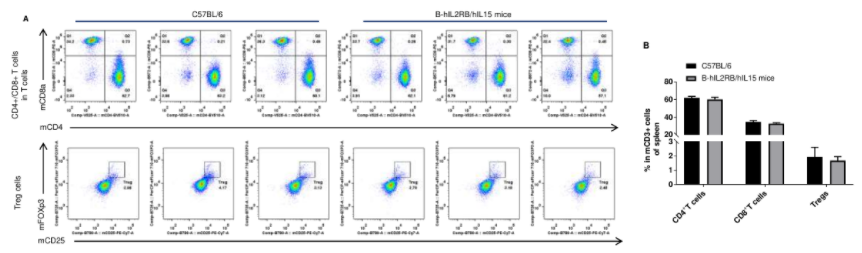
Analysis of T cell subpopulations by FACS. Splenocytes were isolated from female C57BL/6 and B-hIL2RB/hIL15 mice (n=3, 7-week-old). The proportion of T cells subpopulation was tested by flow cytometry. A. Representative FACS plots. Single live cells were gated for the CD3+ population and used for further analysis as indicated here. B. Results of FACS analysis. Percent of CD4+ T cells, CD8+ T cells and Tregs in homozygous B-hIL2RB/hIL15 mice were similar to those in the C57BL/6 mice. Values are expressed as mean ± SEM.
Analysis of blood leukocytes subpopulation
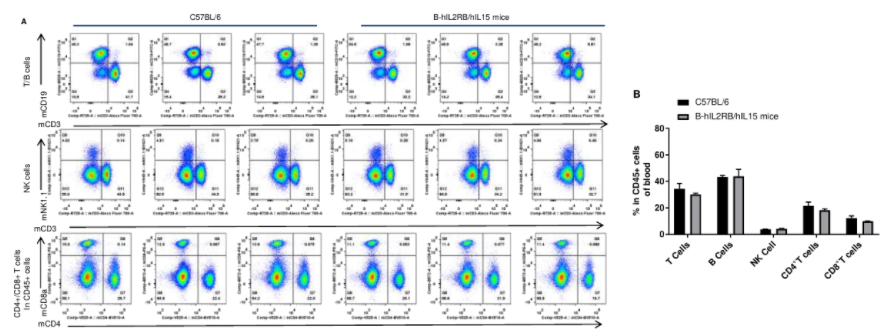
Analysis of blood leukocyte subpopulations by FACS. Blood cells were isolated from female C57BL/6 and B-hIL2RB/hIL15 mice (n=3, 7-week-old). Flow cytometry analysis of the blood cells were performed to assess leukocyte subpopulations. A. Representative FACS plots. Single live cells were gated for the CD45+ population and used for further analysis as indicated here. B. Results of FACS analysis. Percent of T cells, B cells, NK cells, CD4+ T cells and CD8+ T cells in homozygous B-hIL2RB/hIL15 mice were similar to those in the C57BL/6 mice. Values are expressed as mean ± SEM.
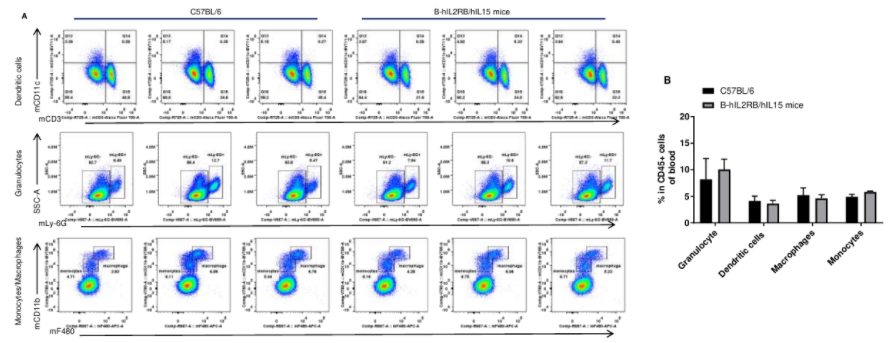
Analysis of blood leukocyte subpopulations by FACS. A. Representative FACS plots. Single live cells were gated for the CD45+ population and used for further analysis as indicated here. B. Results of FACS analysis. Percent of monocytes, dendritic cells, granulocyte and macrophages in B-hIL2RB/hIL15 mice were similar to those in the C57BL/6 mice. Values are expressed as mean ± SEM.
Analysis of blood T leukocytes subpopulation
Analysis of T cell subpopulations by FACS. Blood cells were isolated from female C57BL/6 and B-hIL2RB/hIL15 mice (n=3, 7-week-old). The proportion of T cells subpopulation was tested by flow cytometry. A. Representative FACS plots. Single live cells were gated for the CD3+ population and used for further analysis as indicated here. B. Results of FACS analysis. Percent of CD4+ T cells, CD8+ T cells and Tregs in homozygous B-hIL2RB/hIL15 mice were similar to those in the C57BL/6 mice. Values are expressed as mean ± SEM.
Analysis of lymph node leukocytes subpopulation
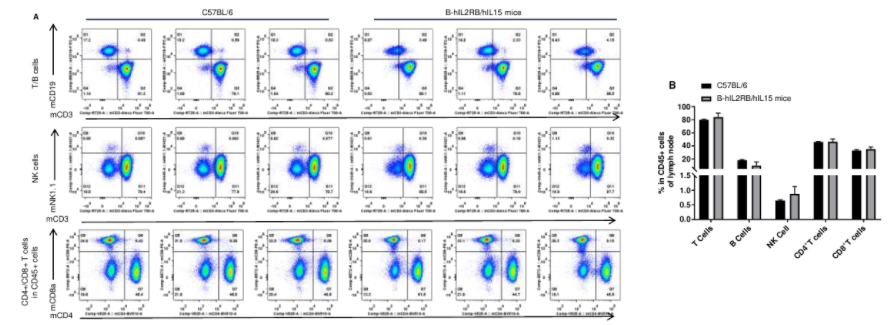
Analysis of lymph node leukocyte subpopulations by FACS. Lymph node cells were isolated from female C57BL/6 and B-hIL2RB/hIL15 mice (n=3, 7-week-old). Flow cytometry analysis of the lymph node cells were performed to assess leukocyte subpopulations. A. Representative FACS plots. Single live cells were gated for the CD45+ population and used for further analysis as indicated here. B. Results of FACS analysis. Percent of T cells, B cells, NK cells, CD4+ T cells and CD8+ T cells in homozygous B-hIL2RB/hIL15 mice were similar to those in the C57BL/6 mice. Values are expressed as mean ± SEM.
Analysis of lymph node T leukocytes subpopulation
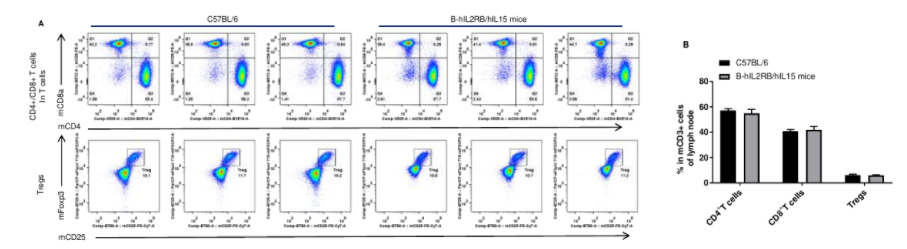
Analysis of T cell subpopulations by FACS. Lymph node cells were isolated from female C57BL/6 and B-hIL2RB/hIL15 mice (n=3, 7-week-old). The proportion of T cells subpopulation was tested by flow cytometry. A. Representative FACS plots. Single live cells were gated for the CD3+ population and used for further analysis as indicated here. B. Results of FACS analysis. Percent of CD4+ T cells, CD8+ T cells and Tregs in homozygous B-hIL2RB/hIL15 mice were similar to those in the C57BL/6 mice. Values are expressed as mean ± SEM.Summary
Protein expression analysis:
Human IL2RB was detectable in T cells and NK cells of homozygous B-hIL2RB/hIL15 mice.
Human IL15 was detectable in serum of homozygous B-hIL2RB/hIL15 mice.
Leukocytes cell subpopulation analysis:
The humanization of these genes does not change the overall development, differentiation or distribution of immune cell types in spleen, blood and lymph node.