

C57BL/6-Il2rbtm2(IL2RB)Bcgen Il2rgtm2(IL2RG)Bcgen/Bcgen • 111850
| Product name | B-hIL2RB/hIL2RG mice |
|---|---|
| Catalog number | 111850 |
| Strain name | C57BL/6-Il2rbtm2(IL2RB)Bcgen Il2rgtm2(IL2RG)Bcgen/Bcgen |
| Strain background | C57BL/6 |
| Aliases | IL2RB: CD122, IL15RB, IMD63, P70-75IL2RG: CD132, CIDX, IL-2RG, IMD4, P64, SCIDX, SCIDX1 |
Gene targeting strategy for B-hIL2RB/hIL2RG mice. The exons 2~8 of mouse Il2rb gene that encodes the extracellular domain were replaced by human IL2RB exons 2~8 in B-hIL2RB/IL2RG mice. The exons 1~8 of mouse Il2rg gene that encodes the full-coding region sequences were replaced by human IL2RG exons 1~8 in B-hIL2RB/IL2RG mice.
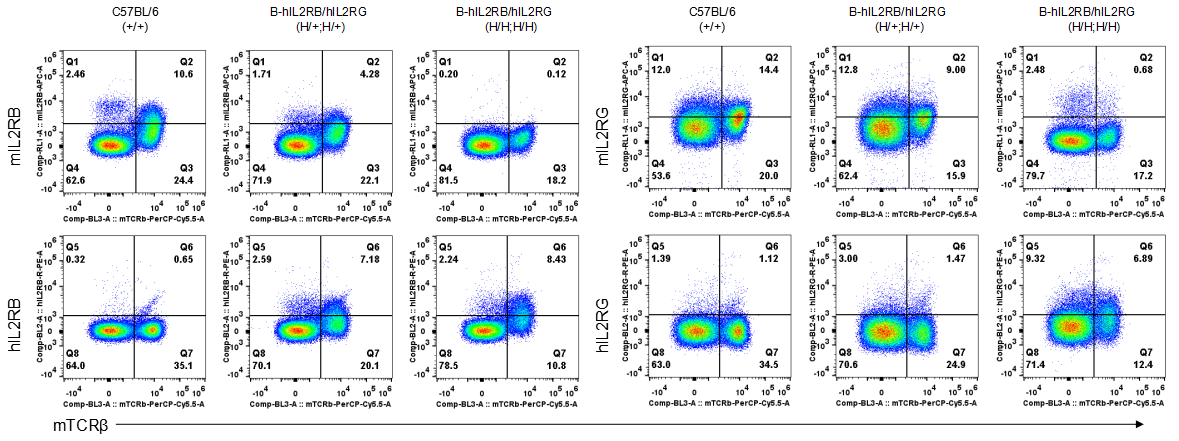
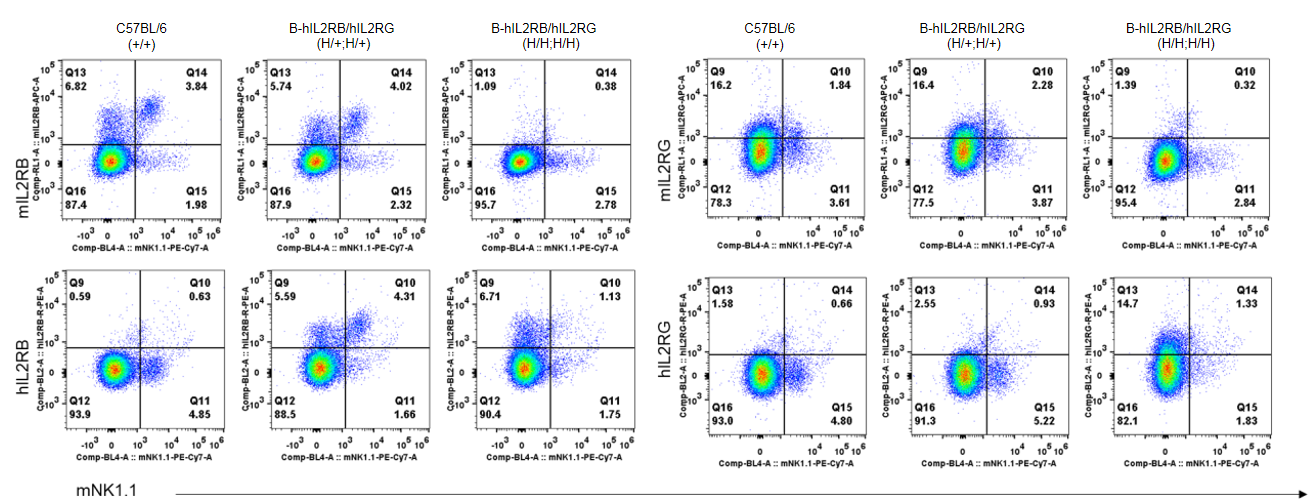
Strain specific IL2RB and IL2RG expression analysis in heterozygous and homozygous B-hIL2RB/hIL2RG mice by flow cytometry. Splenocytes were collected from wild-type mice and B-hIL2RB/hIL2RG mice, and analyzed by flow cytometry with species-specific antibody. Human IL2RB was detectable in heterozygous (H/+;H/+) and homozygous (H/H;H/H) B-hIL2RB/hIL2RG mice. Human IL2RG was too low to detectable in heterozygous mice, and it was unable to assess the IL2RG expression in NK cells, because NK cells were diminished in homozygous B-hIL2RB/hIL2RG mice.
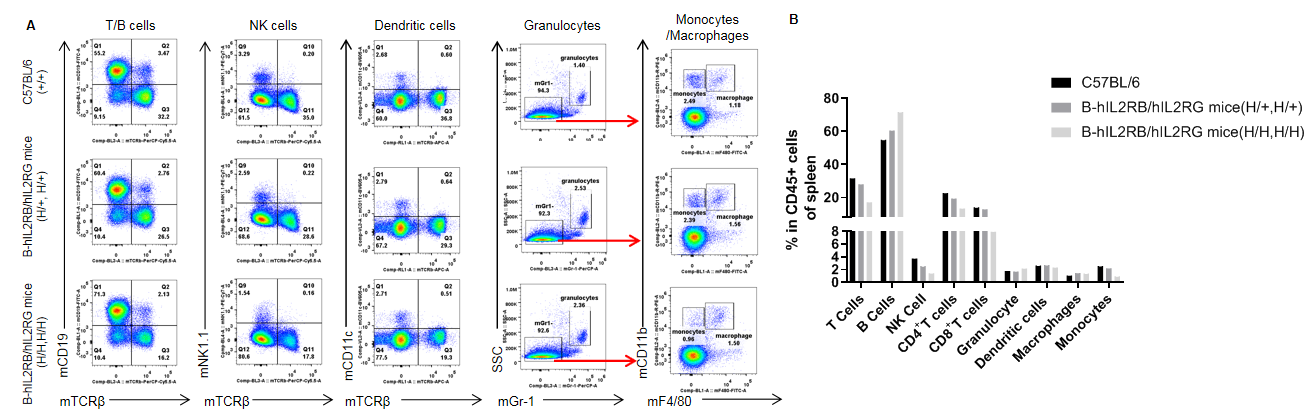
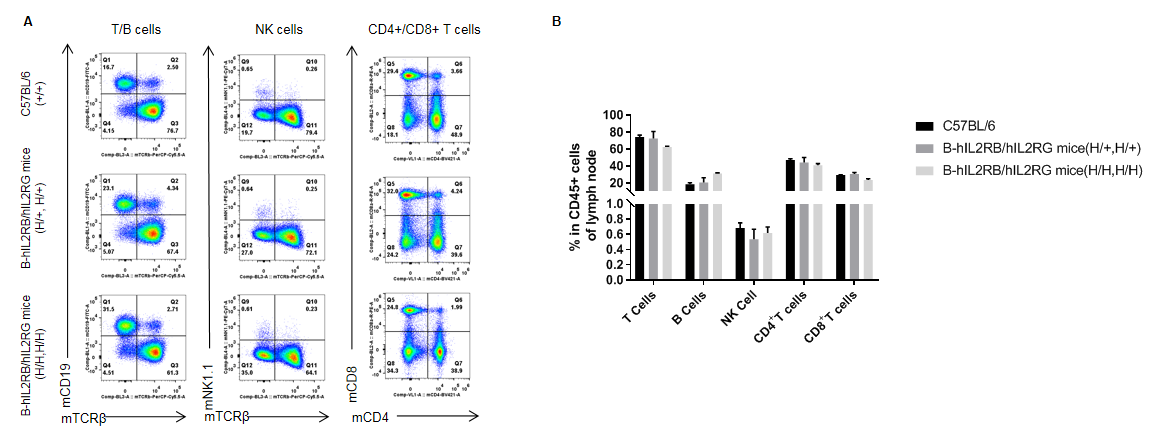
Analysis of lymph node leukocyte subpopulations by FACS. Leukocytes were isolated from female C57BL/6 and B-hIL2RB/hIL2RG mice (n=3, 6-week-old). Flow cytometry analysis of the leukocytes was performed to assess leukocyte subpopulations. A. Representative FACS plots. Single live cells were gated for CD45+ population and used for further analysis as indicated here. B. Results of FACS analysis. The percentages of T cells, B cells, and NK cells in homozygous B-hIL2RB/hIL2RG mice were similar to those observed in C57BL/6 mice. Values are expressed as mean ± SEM.
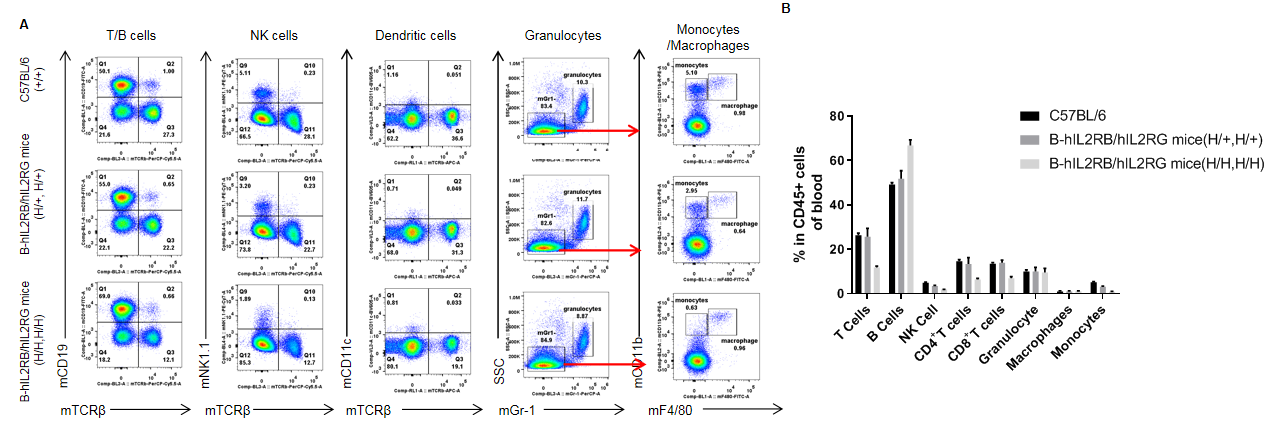
Analysis of blood leukocyte subpopulations by FACS. Leukocytes were isolated from female C57BL/6 and B-hIL2RB/hIL2RG mice (n=3, 6-week-old). Flow cytometry analysis of the leukocytes was performed to assess leukocyte subpopulations. A. Representative FACS plots. Single live cells were gated for CD45+ population and used for further analysis as indicated here. B. Results of FACS analysis. The percentages of T cells, B cells and NK cells were significantly different between homozygous B-hIL2RB/hIL2RG mice and C57BL/6 mice.
Analysis of blood leukocyte subpopulations by FACS. Leukocytes were isolated from female C57BL/6 and B-hIL2RB/hIL2RG mice (n=3, 6-week-old). Flow cytometry analysis of the leukocytes was performed to assess leukocyte subpopulations. A. Representative FACS plots. Single live cells were gated for CD45+ population and used for further analysis as indicated here. B. Results of FACS analysis. The percentages of T cells, B cells and NK cells were significantly different between homozygous B-hIL2RB/hIL2RG mice and C57BL/6 mice.
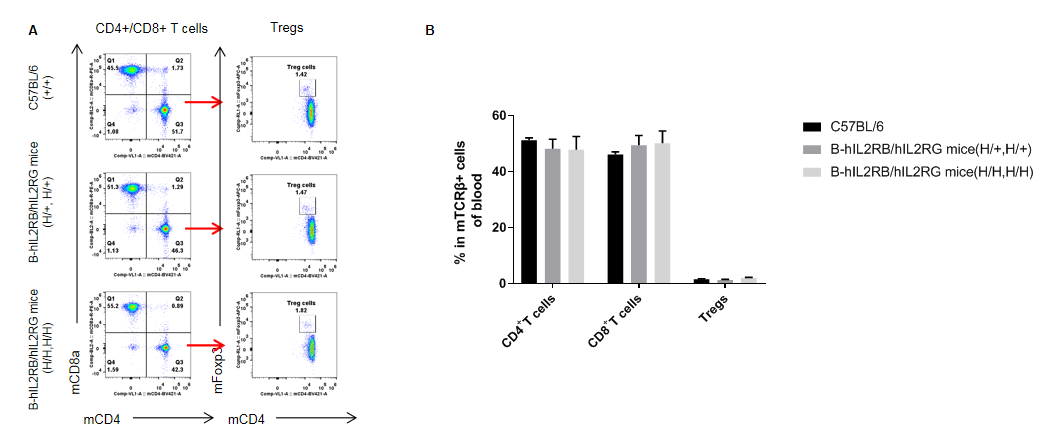
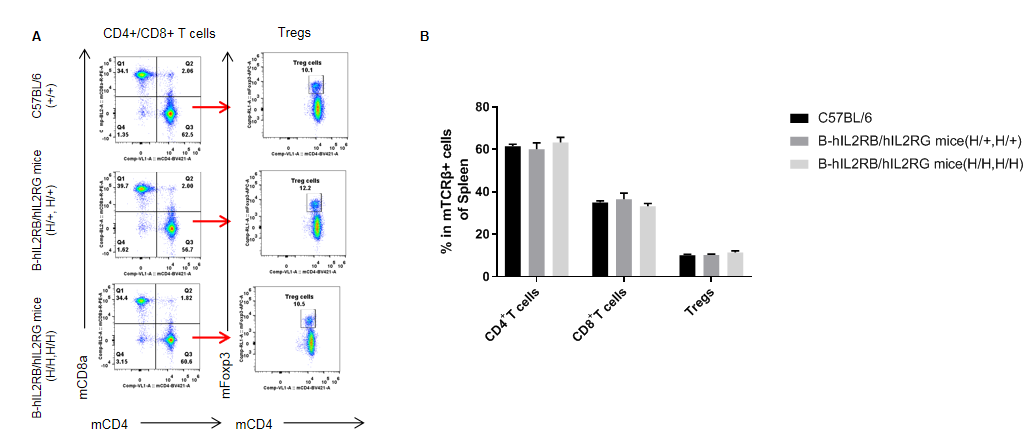
Analysis of blood T subpopulations by FACS. Leukocytes were isolated from female C57BL/6 and B-hIL2RB/hIL2RG mice (n=3, 6-week-old). Flow cytometry analysis of the leukocytes was performed to assess leukocyte subpopulations. A. Representative FACS plots. Single live CD45+ cells were gated for TCRβ+ T cell population and used for further analysis as indicated here. B. Results of FACS analysis. The percentages of CD4+, CD8+, Tregs in homozygous B-hIL2RB/hIL2RG mice mice were similar to those observed in the C57BL/6 mice. Values are expressed as mean ± SEM.
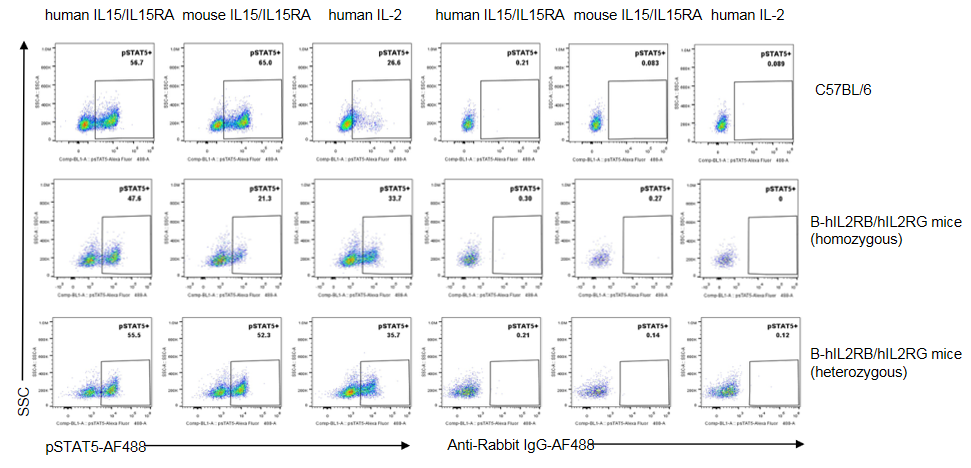
Intracellular pSTAT5 analysis in spleen T cells of B-hIL2RB/hIL2RG mice by flow cytometry. Splenocytes were collected from wild-type C57BL/6 mice, homozygous and heterozygous B-hIL2RB/hIL2RG mice, and stimulated with IL2 or complex of IL15/IL15RA in vitro for 30 min. Then cells were analyzed by flow cytometry with anti-pSTAT5 antibodies. Human IL-2 induced a lower level of STAT5 phosphorylation in C57BL/6 mice compared to humanized mice. For the IL-15/IL-15RA complex, both the mouse and human complexes can induce pSTAT5; however, the mouse complex results in lower phosphorylation levels in homozygous mice. Overall, the humanization of IL-2RB and IL-2RG did not alter the signaling pathway.
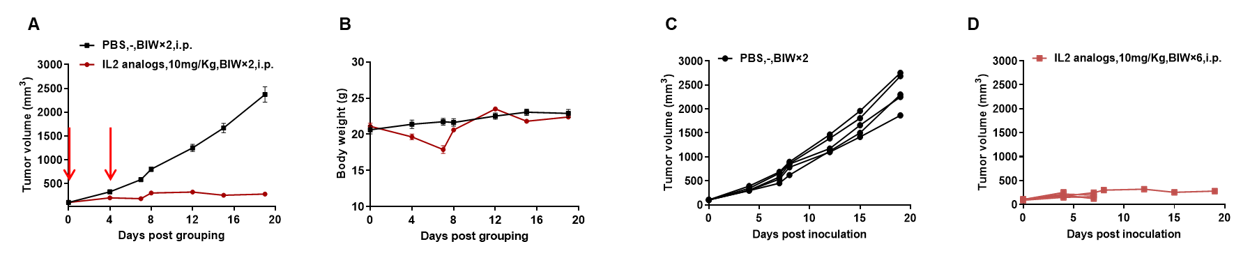
Antitumor activity of IL2 analogs (provided by the client) in B-hIL2RB/hIL2RG mice. (A) MC38 tumor growth. (B) Body weight changes during treatment. The tumor growth curve of individual mice in PBS group (C) and IL2 analogs treatment group (D). Murine colon cancer MC38 cells were subcutaneously implanted into homozygous B-hIL2RB/hIL2RG mice (female, 8 week-old, n=5). Mice were grouped when tumor volume reached approximately 100 mm3, at which time they were treated with IL2 analogs (red arrows). As shown in the panel, IL-2 analogs were effective in controlling tumor growth but also caused some toxicity, resulting in body weight loss and the death of some mice. B-hIL2RB/hIL2RG mice represent a valuable preclinical model for the in vivo evaluation of IL-2 therapeutic molecules. Values are expressed as mean ± SEM.
