

C57BL/6-Pdcd1tm3(PDCD1)BcgenIl21rtm1(IL21R)Bcgen/Bcgen • 111847
| Product name | B-hPD-1 plus/hIL21R mice |
|---|---|
| Catalog number | 111847 |
| Strain name | C57BL/6-Pdcd1tm3(PDCD1)BcgenIl21rtm1(IL21R)Bcgen/Bcgen |
| Strain background | C57BL/6 |
| Aliases | CD279, PD-1, PD1, SLEB2, hPD-1, hPD-l, hSLE1;CD360, IMD56, NILR |
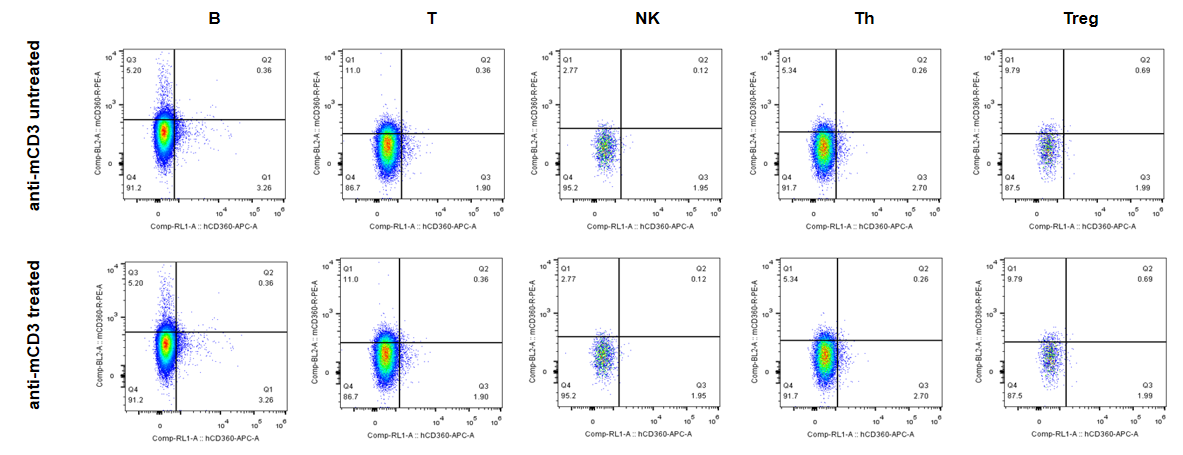
Strain specific IL21R expression analysis in B-hPD-1 plus/hIL21R mice by flow cytometry. Splenocytes were collected from C57BL/6 (+/+) and homozygous B-hPD-1 plus/hIL21R mice (H/H), and analyzed by flow cytometry with species-specific IL21R antibodies. Human IL21R was weakly detectable in homozygous B-hPD-1 plus/hIL21R mice.
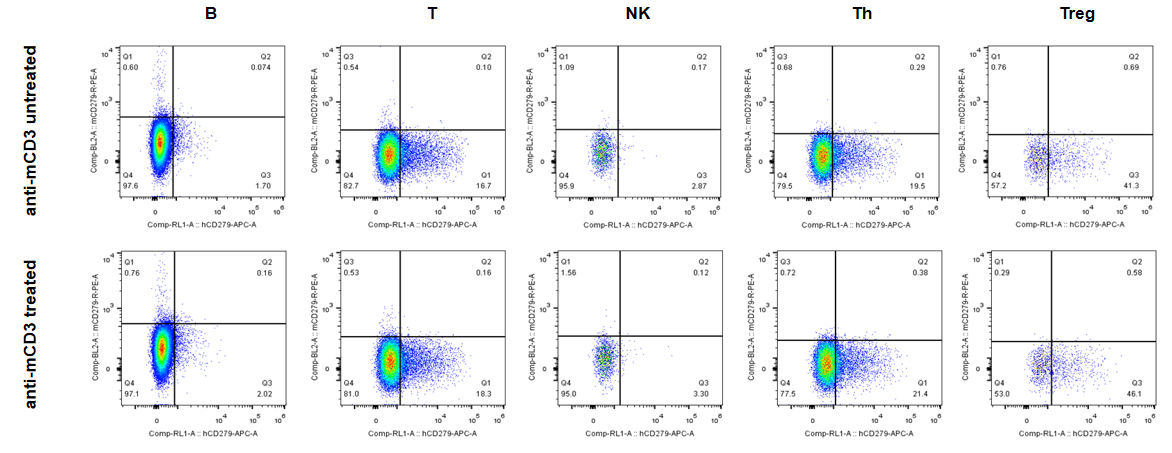
Strain specific IL21R expression analysis in B-hPD-1 plus/hIL21R mice by flow cytometry. Splenocytes were collected from C57BL/6 (+/+) and homozygous B-hPD-1 plus/hIL21R mice (H/H), and analyzed by flow cytometry with species-specific PD-1 antibodies. Human PD-1 was exclusively detectable in homozygous B-hPD-1 plus/hIL21R mice.
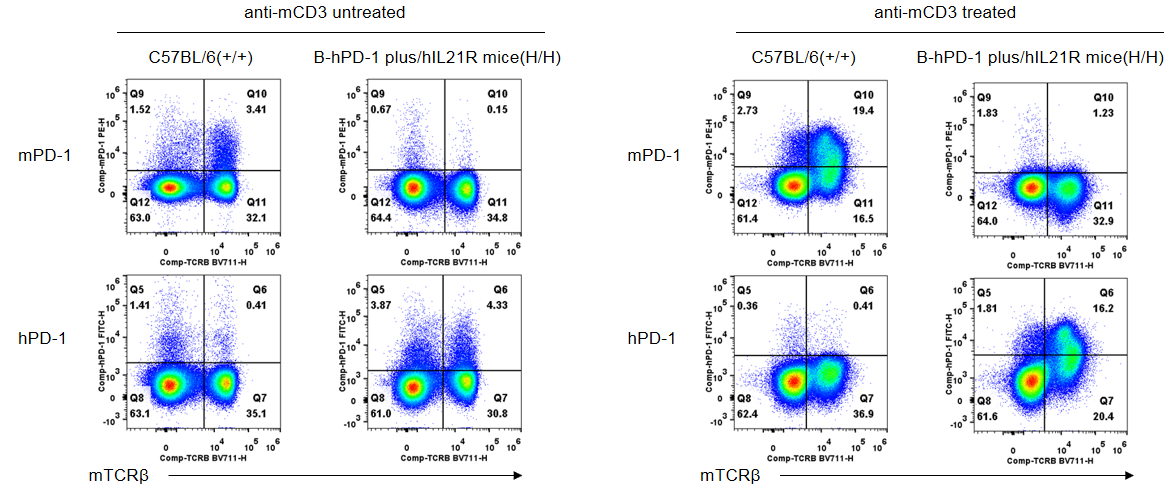
Strain specific PD-1 expression analysis in B-hPD-1 plus/hIL21R mice by flow cytometry. Splenocytes were collected from C57BL/6 (+/+) and homozygous B-hPD-1 plus/hIL21R mice (H/H), and analyzed by flow cytometry with species-specific PD-1 antibodies. Mouse PD-1 was detectable in wild-type mice. Human PD-1 was exclusively detectable in homozygous B-hPD-1 plus/hIL21R mice.
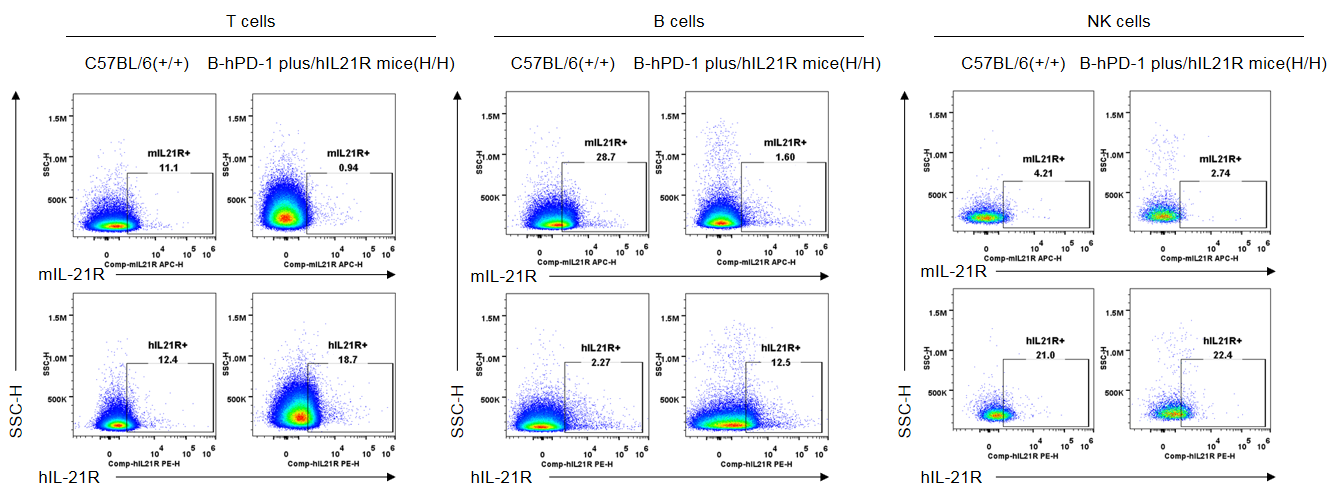
Strain specific IL21R expression analysis in B-hPD-1 plus/hIL21R mice by flow cytometry. Splenocytes were collected from C57BL/6 (+/+) and homozygous B-hPD-1 plus/hIL21R mice (H/H), and analyzed by flow cytometry with anti-hIL21R antibodies. Human IL21R was d
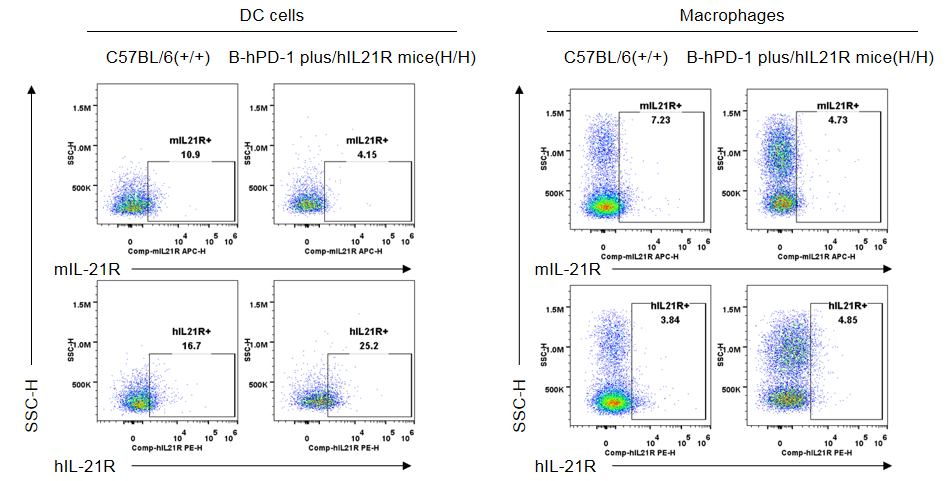
Strain specific IL21R expression analysis in B-hPD-1 plus/hIL21R mice by flow cytometry. Splenocytes were collected from C57BL/6 (+/+) and homozygous B-hPD-1 plus/hIL21R mice (H/H), and analyzed by flow cytometry with anti-hIL21R antibodies. Human IL21R was detectable in T, B and NK cells of homozygous B-hPD-1 plus/hIL21R mice. The anti-hIL21R antibody is crossly reactive with IL21R in human and mice.
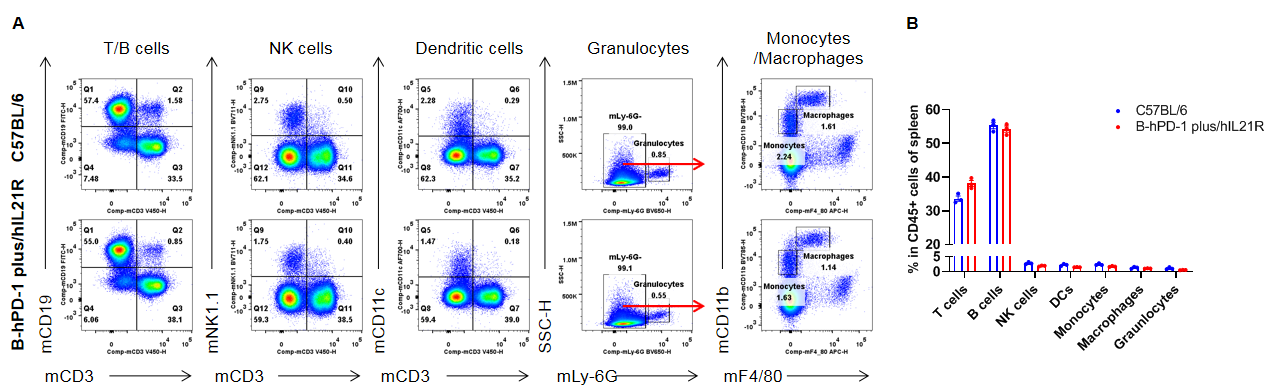
Analysis of spleen leukocyte subpopulations by FACS. Splenocytes were isolated from female C57BL/6 and homozygous B-hPD-1 plus/hIL21R mice(n=3, 8-week-old). Flow cytometry analysis of the splenocytes was performed to assess leukocyte subpopulations. A. Representative FACS plots. Single live cells were gated for the CD45+ population and used for further analysis as indicated. B. Results of FACS analysis. Percent of T cells, B cells, NK cells, dendritic cells, granulocytes, monocytes and macrophages in homozygous B-hPD-1 plus/hIL21R were similar to those in the C57BL/6 mice, demonstrating that introduction of hPD-1 and hIL21R in place of its murine counterpart does not change the overall development, differentiation or distribution of these cell types in spleen. Values are expressed as mean ± SEM.
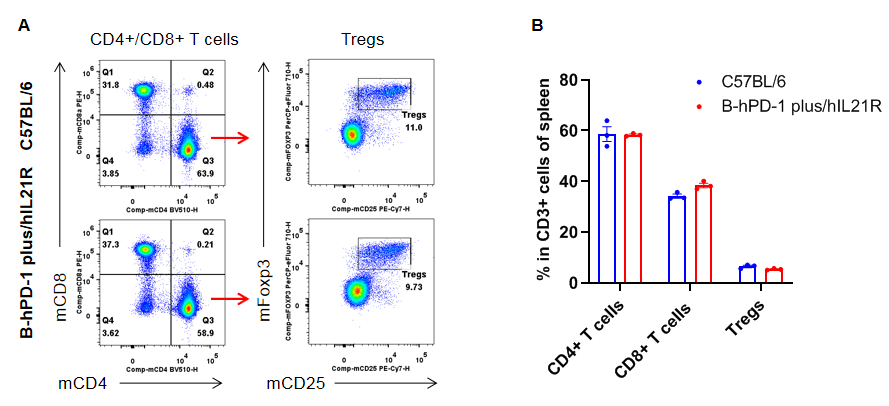
Analysis of spleen T cell subpopulations by FACS. Splenocytes were isolated from female C57BL/6 and homozygous B-hPD-1 plus/hIL21R mice(n=3, 8-week-old). Flow cytometry analysis of the splenocytes was performed to assess leukocyte subpopulations. A. Representative FACS plots. Single live CD45+ cells were gated for CD3+ T cell population and used for further analysis as indicated here. B. Results of FACS analysis. The percent of CD8+ T cells, CD4+ T cells, and Tregs in homozygous B-hPD-1 plus/hIL21R mice were similar to those in the C57BL/6 mice, demonstrating that introduction of hPD-1 and hIL21R in place of its murine counterpart does not change the overall development, differentiation or distribution of these T cell subtypes in spleen. Values are expressed as mean ± SEM.
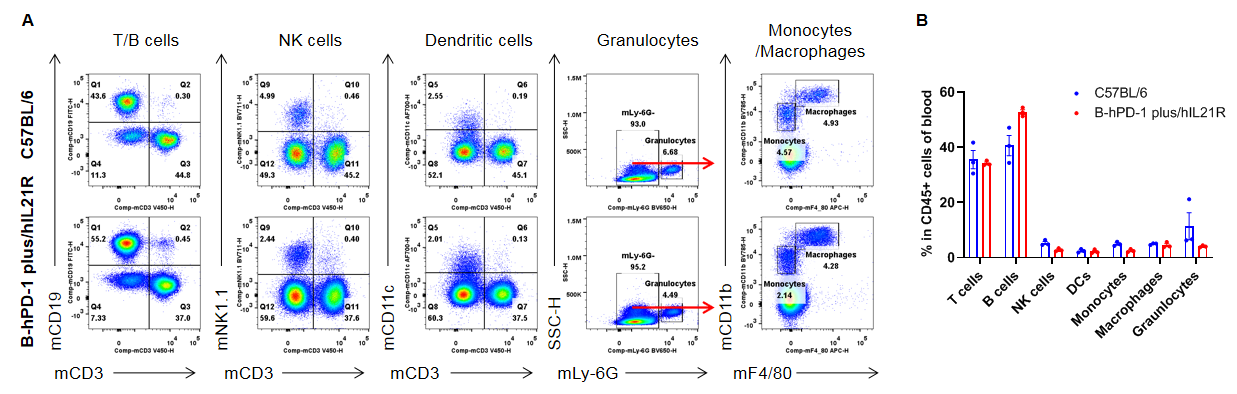
Analysis of blood leukocyte subpopulations by FACS. Blood were isolated from female C57BL/6 and homozygous B-hPD-1 plus/hIL21R mice(n=3, 8-week-old). Flow cytometry analysis of the splenocytes was performed to assess leukocyte subpopulations. A. Representative FACS plots. Single live cells were gated for the CD45+ population and used for further analysis as indicated. B. Results of FACS analysis. Percent of T cells, B cells, NK cells, dendritic cells, granulocytes, monocytes and macrophages in homozygous B-hPD-1 plus/hIL21R were similar to those in the C57BL/6 mice, demonstrating that introduction of hPD-1 and hIL21R in place of its murine counterpart does not change the overall development, differentiation or distribution of these cell types in blood. Values are expressed as mean ± SEM.
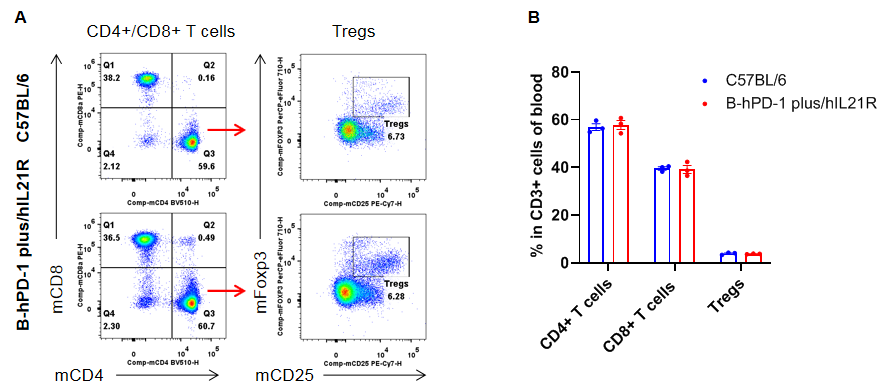
Analysis of blood T cell subpopulations by FACS. Blood were isolated from female C57BL/6 and homozygous B-hPD-1 plus/hIL21R mice(n=3, 8-week-old). Flow cytometry analysis of the splenocytes was performed to assess leukocyte subpopulations. A. Representative FACS plots. Single live CD45+ cells were gated for CD3+ T cell population and used for further analysis as indicated. B. Results of FACS analysis. The percent of CD8+ T cells, CD4+ T cells, and Tregs in homozygous B-hPD-1 plus/hIL21R mice were similar to those in the C57BL/6 mice, demonstrating that introduction of hPD-1 and hIL21R in place of its murine counterpart does not change the overall development, differentiation or distribution of these T cell subtypes in blood. Values are expressed as mean ± SEM.
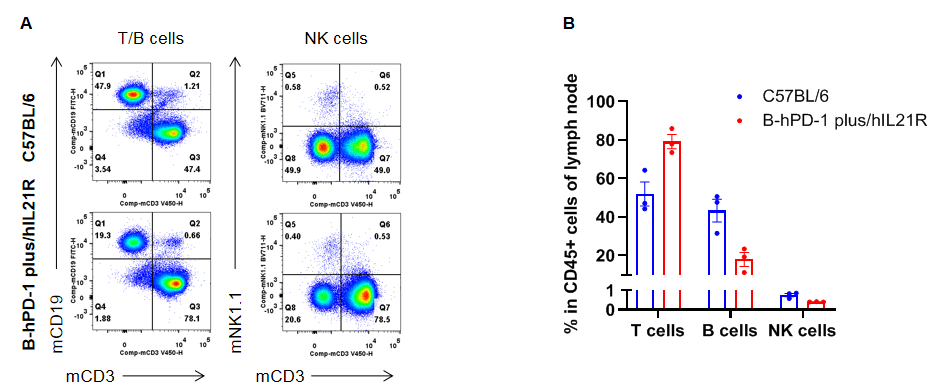
Analysis of lymph nodes leukocyte subpopulations by FACS. Lymph nodes were isolated from female C57BL/6 and homozygous B-hPD-1 plus/hIL21R mice(n=3, 8-week-old). Flow cytometry analysis of the splenocytes was performed to assess leukocyte subpopulations. A. Representative FACS plots. Single live cells were gated for the CD45+ population and used for further analysis as indicated. B. Results of FACS analysis. Percent of T cells, B cells, NK cells, dendritic cells, granulocytes, monocytes and macrophages in homozygous B-hPD-1 plus/hIL21R were similar to those in the C57BL/6 mice, demonstrating that introduction of hPD-1 and hIL21R in place of its murine counterpart does not change the overall development, differentiation or distribution of these cell types in lymph nodes. Values are expressed as mean ± SEM.
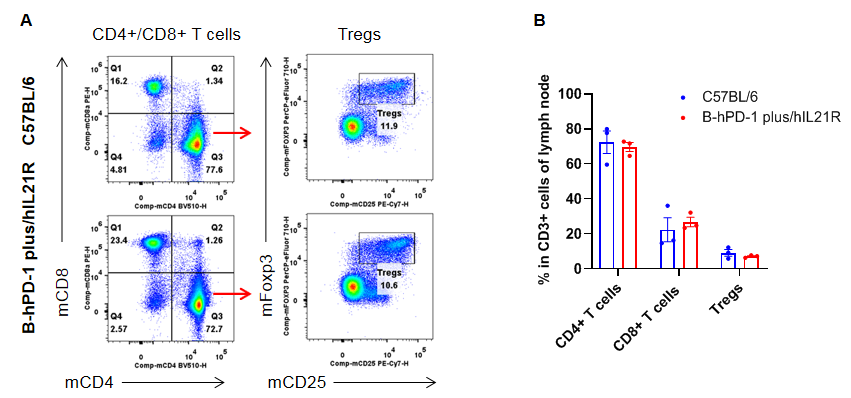
Analysis of lymph nodes T cell subpopulations by FACS. Lymph nodes were isolated from female C57BL/6 and homozygous B-hPD-1 plus/hIL21R mice(n=3, 8-week-old). Flow cytometry analysis of the splenocytes was performed to assess leukocyte subpopulations. A. Representative FACS plots. Single live CD45+ cells were gated for CD3+ T cell population and used for further analysis as indicated. B. Results of FACS analysis. The percent of CD8+ T cells, CD4+ T cells, and Tregs in homozygous B-hPD-1 plus/hIL21R mice were similar to those in the C57BL/6 mice, demonstrating that introduction of hPD-1 and hIL21R in place of its murine counterpart does not change the overall development, differentiation or distribution of these T cell subtypes in lymph nodes. Values are expressed as mean ± SEM.
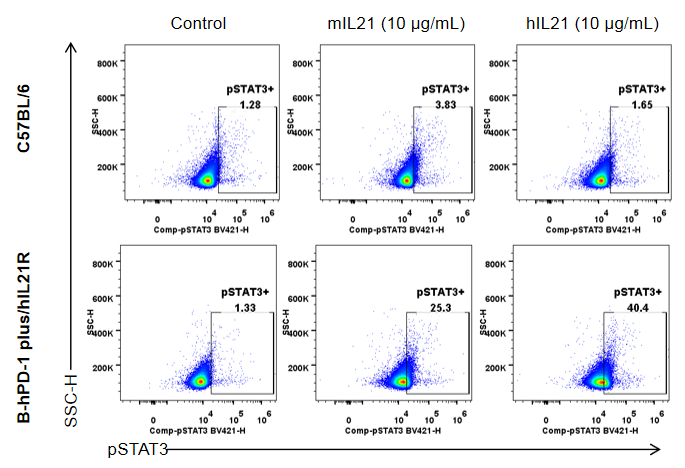
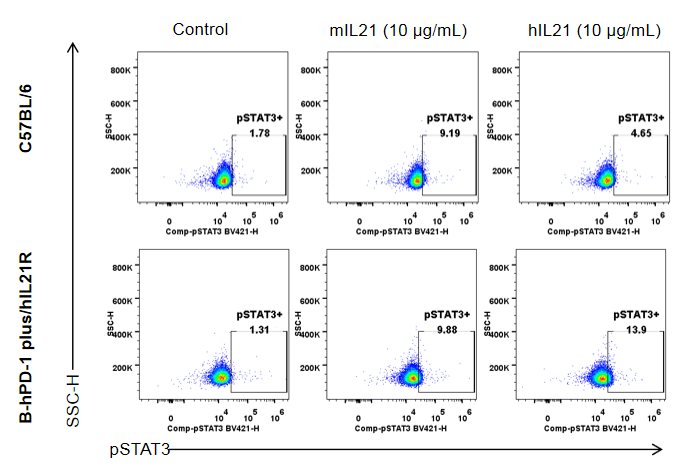
Mouse pSTAT3 was induced with mouse IL21 and human IL21 in homozygous B-hPD-1 plus/hIL21R mice analyzed by flow cytometry. Splenocytes were collected from homozygous B-hPD-1 plus/hIL21R mice (H/H), and stimulated with culture medium, mIL21 or hIL21. The induction of STAT5 phosphorylation on B cells with the indicated stimulators was assayed by flow cytometry. Results indicated that STAT3 phosphorylation was successfully induced with mouse IL21 or human IL21 in homozygous B-hPD-1 plus/hIL21R mice.
Mouse pSTAT3 was induced with mouse IL21 and human IL21 in homozygous B-hPD-1 plus/hIL21R mice analyzed by flow cytometry. Splenocytes were collected from homozygous B-hPD-1 plus/hIL21R mice (H/H), and stimulated with culture medium, mIL21 or hIL21. The induction of STAT5 phosphorylation on CD8+T cells with the indicated stimulators was assayed by flow cytometry. Results indicated that STAT3 phosphorylation was successfully induced with mouse IL21 or human IL21 in homozygous B-hPD-1 plus/hIL21R mice.
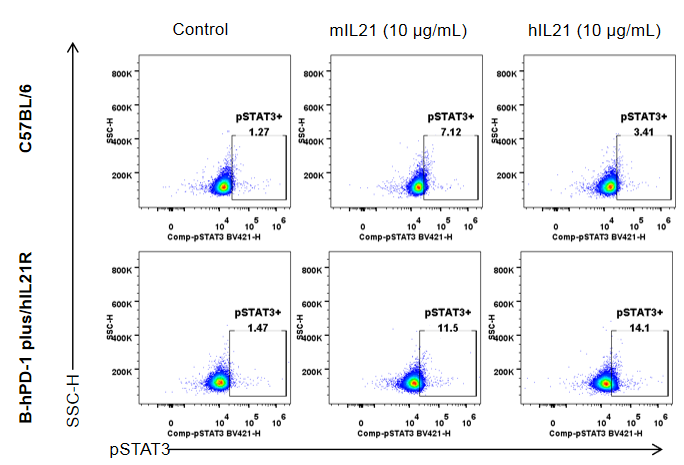
Mouse pSTAT3 was induced with mouse IL21 and human IL21 in homozygous B-hPD-1 plus/hIL21R mice analyzed by flow cytometry. Splenocytes were collected from homozygous B-hPD-1 plus/hIL21R mice (H/H), and stimulated with culture medium, mIL21 or hIL21. The induction of STAT5 phosphorylation on CD4+T cells with the indicated stimulators was assayed by flow cytometry. Results indicated that STAT3 phosphorylation was successfully induced with mouse IL21 or human IL21 in homozygous B-hPD-1 plus/hIL21R mice.

Antitumor activity of Ab1 (provided by a client) in B-hPD-1 plus/hIL21R mice. Ab1 inhibited B-hPD-L1 MC38 tumor growth in B-hPD-1 plus/hIL21R mice. (A,B) 5E5 and (C,D) 1E6 murine B-hPD-L1 MC38 cells (provided by a client) were subcutaneously implanted into homozygous B-hPD-1 plus/hIL21R mice (female, 7-week-old, n=5), respectively. Mice were grouped when tumor volume reached approximately 100-150 mm3, at which time they were intraperitoneally injected with Ab1 indicated in panel. (B) and (D) Body weight changes during treatment. As shown in panel (A) and (C), Ab1 was efficacious in controlling tumor growth in B-hPD-1 plus/hIL21R mice, demonstrating that the B-hPD-1 plus/hIL21R mice provide a powerful preclinical model for in vivo evaluation of Ab1. Values are expressed as mean ± SEM. Significance was determined by two-way ANOVA test. *P < 0.05, **P < 0.01, ***p < 0.001. Note: This experiment was performed by the client using B-hPD-1 plus/hIL21R mice. All the other materials were provided by the client.
