Non-disclosure • 112744
| Product name | B-hTSLP/hTSLPR mice plus |
|---|---|
| Catalog number | 112744 |
| Strain name | Non-disclosure |
| Strain background | C57BL/6 |
| NCBI gene ID | 53603, 57914 (Human) |
| Aliases | NA; CRLM2, Ly114, Tslpr |
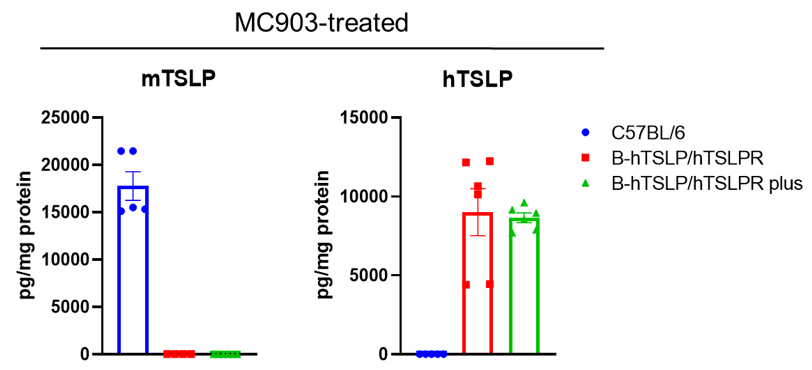
Strain specific TSLP expression analysis in wild-type C57BL/6 mice, homozygous B-hTSLP/hTSLPR mice and B-hTSLP/hTSLPR mice plus by ELISA. Calcipotriol (MC903) was dissolved in ethanol and topically applied on ears of wild-type C57BL/6 mice, homozygous B-hTSLP/hTSLPR mice and B-hTSLP/hTSLPR mice plus for 7 days (male, 8-week-old, n=3). Expression level of mouse and human TSLP in ear grinding supernatant from the three strains of mice were analyzed by ELISA (mouse TSLP: Biolegend, 434107; human TSLP: Biolegend, 434207). Mouse TSLP was only detectable in wild-type C57BL/6 mice. Human TSLP was detectable in homozygous B-hTSLP/hTSLPR mice and B-hTSLP/hTSLPR mice plus but not in wild-type mice.
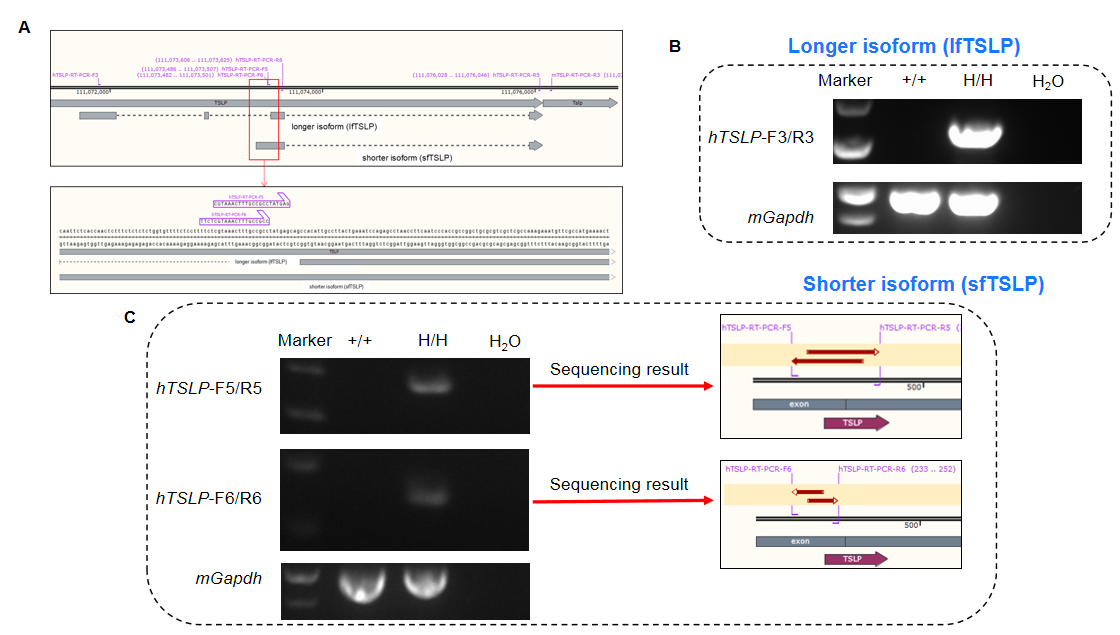
Longer and shorter isoform of human TSLP were detectable in B-hTSLP/hTSLPR mice plus by RT-PCR and sequencing. Ear tissues were isolated from wild-type C57BL/6 mice (+/+) and homozygous B-hTSLP/hTSLPR mice plus (H/H). A. Primers were designed to detect longer isoform (lfTSLP) and shorter isoform (sfTSLP) of human TSLP; B. LfTSLP mRNA was detectable in B-hTSLP/hTSLPR mice plus, but not in wild-type mice; C. SfTSLP mRNA was detectable in B-hTSLP/hTSLPR mice plus, but not in wild-type mice. The sequencing results of the shorter isoform PCR products confirmed that the sequences amplified in mice were consistent with those in the database.
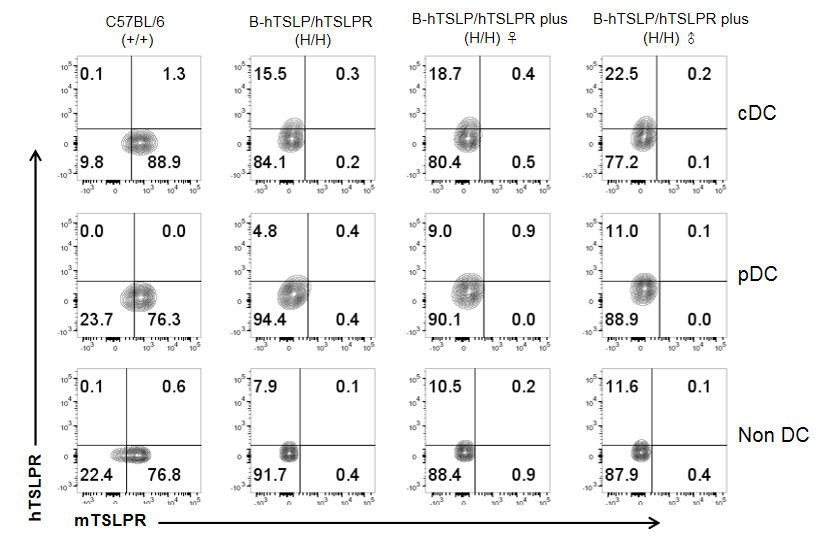
Mouse and human TSLPR expression analysis in splenocytes. Splenocytes were collected from wild-type C57BL/6 mice, homozygous B-hTSLP/hTSLPR mice and B-hTSLP/hTSLPR mice plus. TSLPR expression on cDC, pDC and non DCs were analyzed by flow cytometry with species-specific anti-TSLPR antibody. Mouse TSLPR were detectable on cDC, pDC and non DCs of wild-type C57BL/6 mice, but not on the cells of TSLPR humanized mice. Human TSLPR was detectable on cDC, pDC and non DCs of B-hTSLP/hTSLPR mice and B-hTSLP/hTSLPR mice plus, but not on the cells of wild-type C57BL/6 mice.

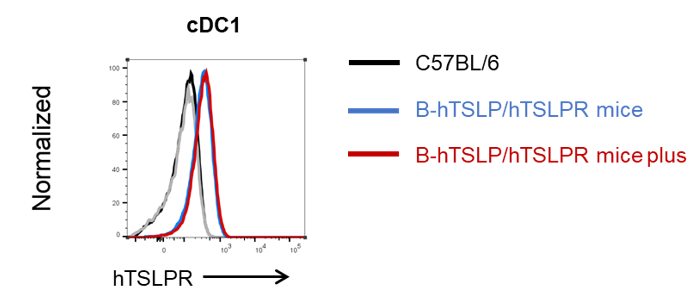
Human TSLPR expression analysis in cDC1 from bone marrow. Bone marrow were collected from wild-type C57BL/6 mice, homozygous B-hTSLP/hTSLPR mice and B-hTSLP/hTSLPR mice plus. Human TSLPR expression on cDC1 were analyzed by flow cytometry with species-specific antibodies. Human TSLPR was highly expressed on the cDC1 in B-hTSLP/hTSLPR mice and B-hTSLP/hTSLPR mice plus.
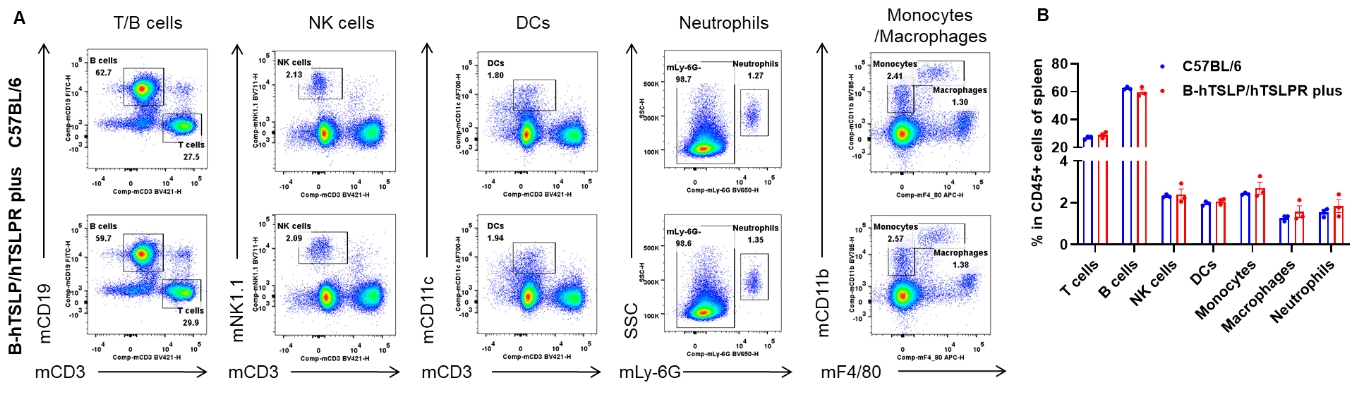
Analysis of spleen leukocyte subpopulations by flow cytometry. Splenocytes were isolated from female C57BL/6 and B-hTSLP/hTSLPR mice plus (n=3, 9-week-old). Flow cytometry analysis of the splenocytes was performed to assess leukocyte subpopulations. A. Representative FACS plots. Single live cells were gated for the CD45+ population and used for further analysis as indicated here. B. Results of FACS analysis. Percent of T cells, B cells, NK cells, DCs, neutrophils, monocytes and macrophages in homozygous B-hTSLP/hTSLPR mice plus were similar to those in the C57BL/6 mice, demonstrating that TSLP, TSLPR and IL7R humanization does not change the overall development, differentiation or distribution of these cell types in spleen. Values are expressed as mean ± SEM.
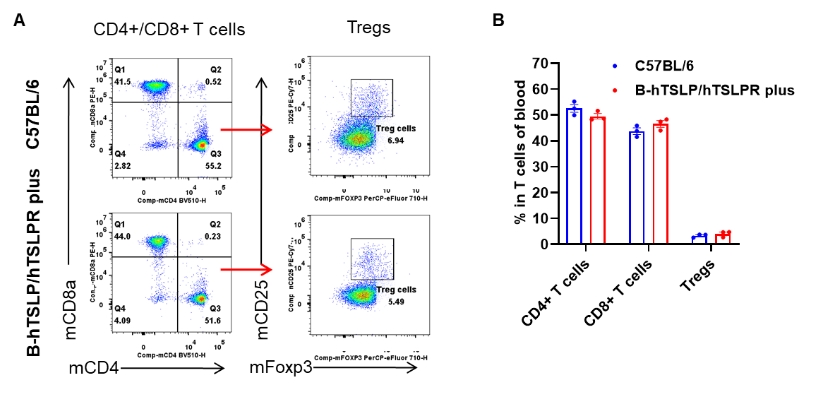
Analysis of blood T cell subpopulations by flow cytometry. Blood were isolated from female C57BL/6 and B-hTSLP/hTSLPR mice plus (n=3, 9-week-old). Flow cytometry analysis of the blood was performed to assess leukocyte subpopulations. A. Representative FACS plots. Single live CD45+ cells were gated for CD3+ T cell population and used for further analysis as indicated here. B. Results of FACS analysis. The percent of CD4+ T cells, CD8+ T cells and Tregs in homozygous B-hTSLP/hTSLPR mice plus were similar to those in the C57BL/6 mice, demonstrating that TSLP, TSLPR and IL7R humanization does not change the overall development, differentiation or distribution of these T cell types in blood. Values are expressed as mean ± SEM.
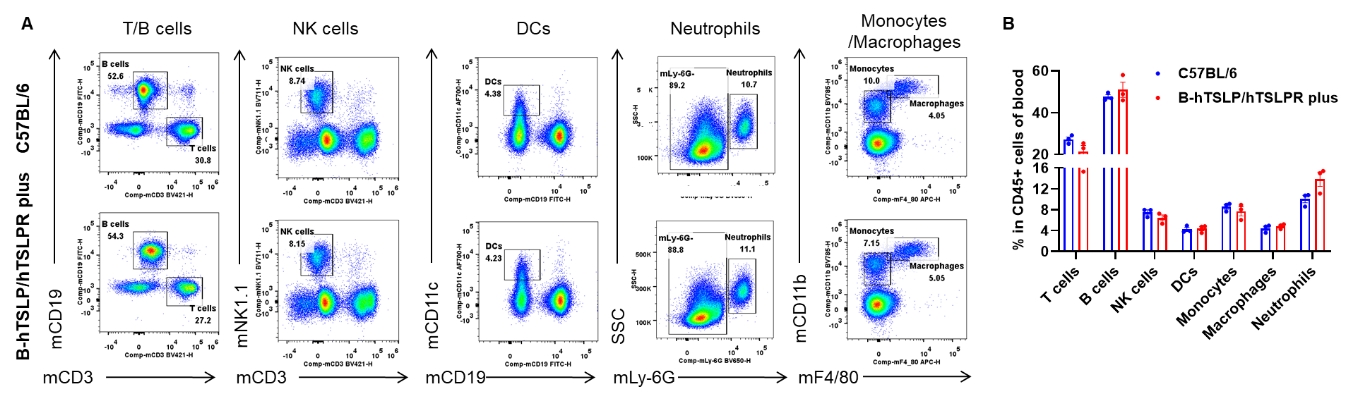
Analysis of blood leukocyte subpopulations by flow cytometry. Blood were isolated from female C57BL/6 and B-hTSLP/hTSLPR mice plus (n=3, 9-week-old). Flow cytometry analysis of the blood was performed to assess leukocyte subpopulations. A. Representative FACS plots. Single live cells were gated for the CD45+ population and used for further analysis as indicated here. B. Results of FACS analysis. Percent of T cells, B cells, NK cells, dendritic cells, neutrophils, monocytes and macrophages in homozygous B-hTSLP/hTSLPR mice plus were similar to those in the C57BL/6 mice, demonstrating that TSLP, TSLPR and IL7R humanization does not change the overall development, differentiation or distribution of these cell types in blood. Values are expressed as mean ± SEM.
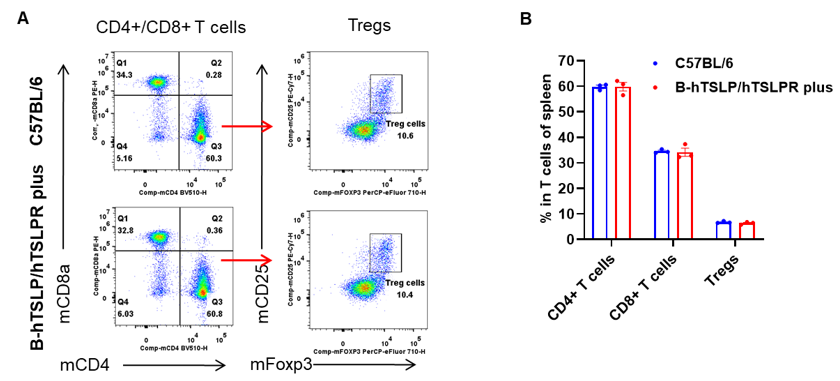
Analysis of thymus T cell subpopulations by flow cytometry. Thymuses were isolated from female C57BL/6 and B-hTSLP/hTSLPR mice plus (n=3, 9-week-old). Flow cytometry analysis of the thymus was performed to assess leukocyte subpopulations. A. Representative FACS plots. Single live CD45+ cells were gated for CD3+ T cell population and used for further analysis as indicated here. B. Results of FACS analysis. The percent of CD4+ T cells, CD8+ T cells and Tregs in homozygous B-hTSLP/hTSLPR mice plus were similar to those in the C57BL/6 mice, demonstrating that TSLP, TSLPR and IL7R humanization does not change the overall development, differentiation or distribution of these T cell types in thymus. Values are expressed as mean ± SEM.
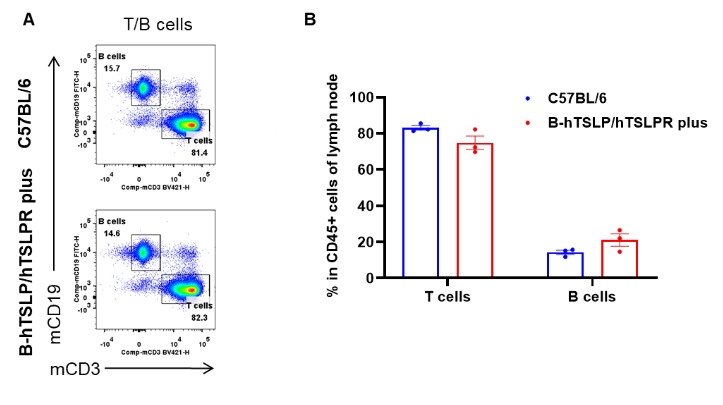
Analysis of lymph node leukocyte subpopulations by flow cytometry. Lymph nodes were isolated from female C57BL/6 and B-hTSLP/hTSLPR mice plus (n=3, 9-week-old). Flow cytometry analysis of the lymph node was performed to assess leukocyte subpopulations. A. Representative FACS plots. Single live cells were gated for the CD45+ population and used for further analysis as indicated here. B. Results of FACS analysis. Percent of T cells and B cells in homozygous B-hTSLP/hTSLPR mice plus were similar to those in the C57BL/6 mice, demonstrating that TSLP, TSLPR and IL7R humanization does not change the overall development, differentiation or distribution of these cell types in lymph node. Values are expressed as mean ± SEM.
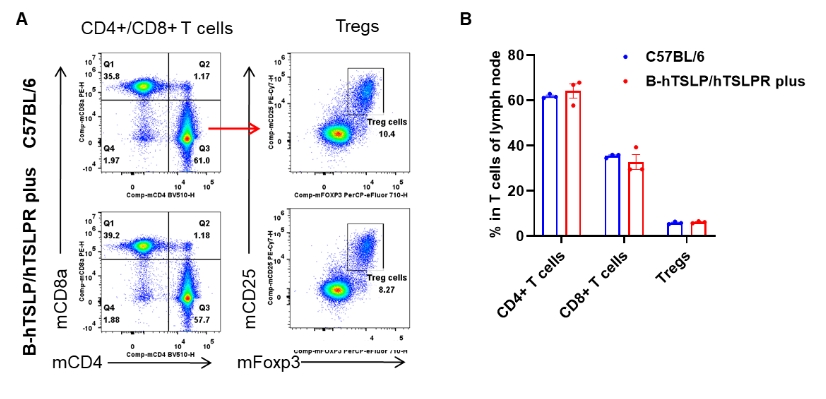
Analysis of lymph node T cell subpopulations by flow cytometry. Lymph nodes were isolated from female C57BL/6 and B-hTSLP/hTSLPR mice plus (n=3, 9-week-old). Flow cytometry analysis of the lymph node was performed to assess leukocyte subpopulations. A. Representative FACS plots. Single live CD45+ cells were gated for CD3+ T cell population and used for further analysis as indicated here. B. Results of FACS analysis. The percent of CD4+ T cells, CD8+ T cells and Tregs in homozygous B-hTSLP/hTSLPR mice plus were similar to those in the C57BL/6 mice, demonstrating that TSLP, TSLPR and IL7R humanization does not change the overall development, differentiation or distribution of these T cell types in lymph node. Values are expressed as mean ± SEM.
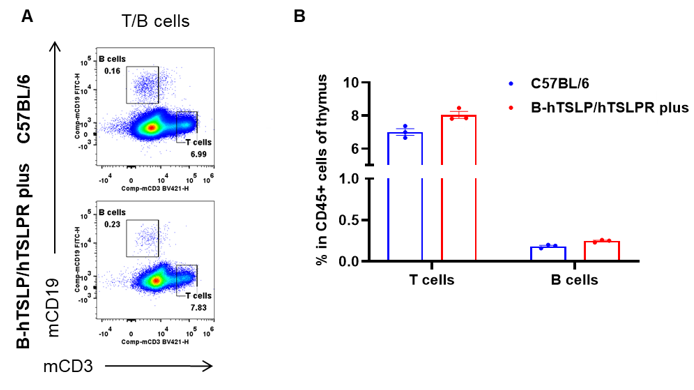
Analysis of thymus leukocyte subpopulations by flow cytometry. Thymuses were isolated from female C57BL/6 and B-hTSLP/hTSLPR mice plus (n=3, 9-week-old). Flow cytometry analysis of the thymus was performed to assess leukocyte subpopulations. A. Representative FACS plots. Single live cells were gated for the CD45+ population and used for further analysis as indicated here. B. Results of FACS analysis. Percent of T cells and B cells in homozygous B-hTSLP/hTSLPR mice plus were similar to those in the C57BL/6 mice, demonstrating that TSLP, TSLPR and IL7R humanization does not change the overall development, differentiation or distribution of these cell types in thymus. Values are expressed as mean ± SEM.
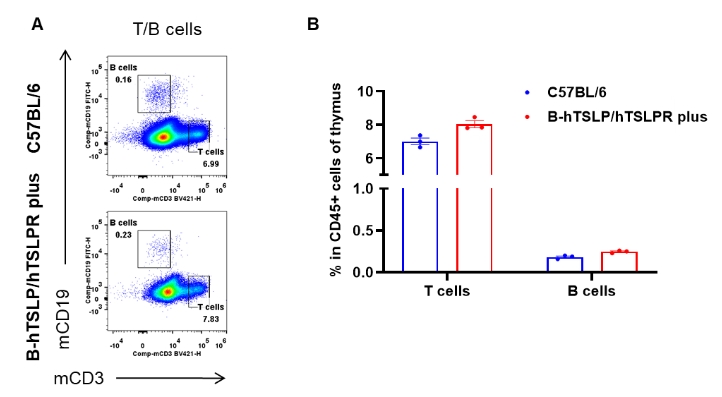
Analysis of thymus leukocyte subpopulations by flow cytometry. Thymuses were isolated from female C57BL/6 and B-hTSLP/hTSLPR mice plus (n=3, 9-week-old). Flow cytometry analysis of the thymus was performed to assess leukocyte subpopulations. A. Representative FACS plots. Single live cells were gated for the CD45+ population and used for further analysis as indicated here. B. Results of FACS analysis. Percent of T cells and B cells in homozygous B-hTSLP/hTSLPR mice plus were similar to those in the C57BL/6 mice, demonstrating that TSLP, TSLPR and IL7R humanization does not change the overall development, differentiation or distribution of these cell types in thymus. Values are expressed as mean ± SEM.
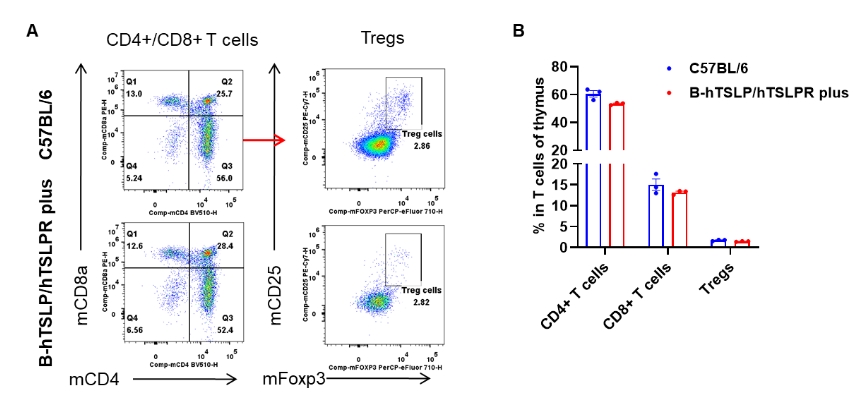
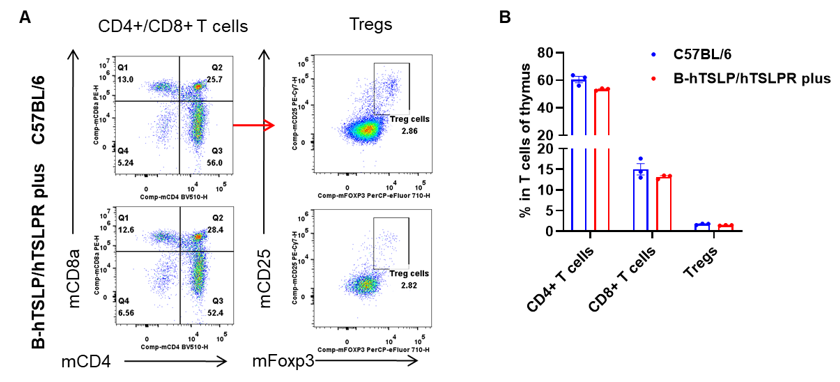
Analysis of thymus T cell subpopulations by flow cytometry. Thymuses were isolated from female C57BL/6 and B-hTSLP/hTSLPR mice plus (n=3, 9-week-old). Flow cytometry analysis of the thymus was performed to assess leukocyte subpopulations. A. Representative FACS plots. Single live CD45+ cells were gated for CD3+ T cell population and used for further analysis as indicated here. B. Results of FACS analysis. The percent of CD4+ T cells, CD8+ T cells and Tregs in homozygous B-hTSLP/hTSLPR mice plus were similar to those in the C57BL/6 mice, demonstrating that TSLP, TSLPR and IL7R humanization does not change the overall development, differentiation or distribution of these T cell types in thymus. Values are expressed as mean ± SEM.
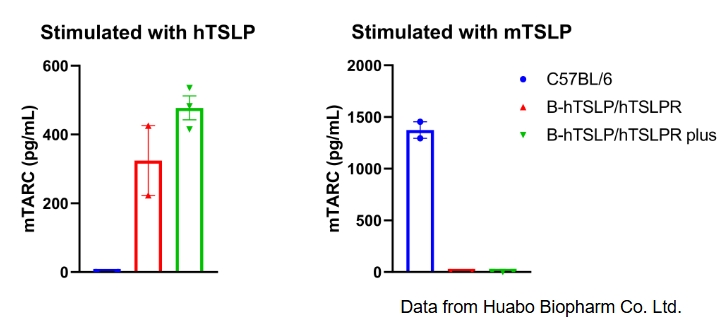
Mouse TARC was respectively induced with human TSLP and mouse TSLP in wild type C57BL/6 mice, homozygous B-hTSLP/hTSLPR mice and B-hTSLP/hTSLPR mice plus. Dendritic cells were respectively induced with FLT3L from bone marrow of the three strains and stimulated with human TSLP or mouse TSLP in vitro. Concentration of mouse TARC secreted from DCs was assayed by ELISA. Mouse TARC was successfully induced with human TSLP, but not mouse TSLP in homozygous B-hTSLP/hTSLPR mice and B-hTSLP/hTSLPR mice plus. The level of mTARC in B-hTSLP/hTSLPR mice plus was higher than that in B-hTSLP/hTSLPR mice plus. Meanwhile mouse TARC was successfully induced with mouse TSLP, but not human TSLP in wild-type C57BL/6 mice. Results indicated that TSLP and TSLPR are not cross-reactive between mouse and human. Human TSLP can activate the dendritic cells of B-hTSLP/hTSLPR mice and B-hTSLP/hTSLPR mice plus.
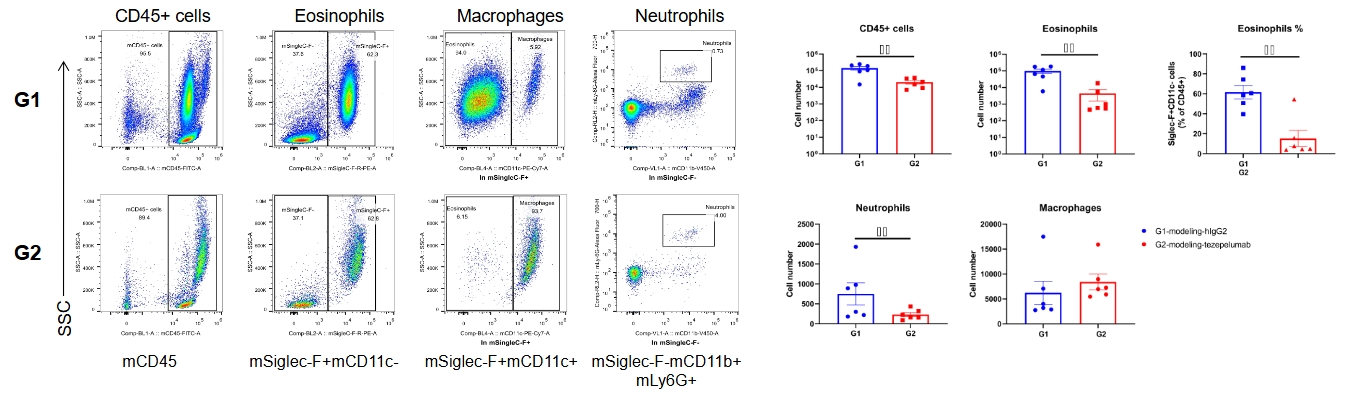
Analysis of inflammatory cells in BALF by FACS. Mouse asthma model was induced in B-hTSLP/hTSLPR mice plus and treated with anti-human TSLP antibody (tezepelumab, synthesized in house). BALF was collected at the end of the experiment to detect infiltrated inflammatory cells in lung tissue. The results showed that CD45+ cells, eosinophils and neutrophils in the group (G2) treated with anti-human TSLP antibody decreased significantly when compared with the group (G1) treated with isotype antibody. Values are expressed as mean ± SEM.
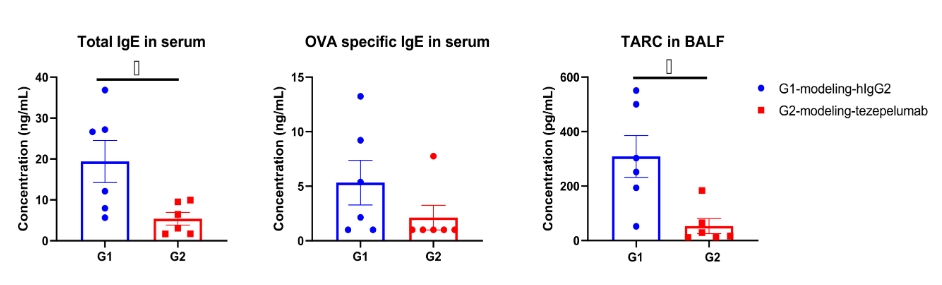
OVA specific IgE in serum and TARC in BALF were significantly reduced in the mouse asthma model treated with anti-TSLP antibody. Serum was collected at the study endpoint. IgE and TARC levels were analyzed by ELISA. The results showed that the levels of OVA specific IgE and TARC in mice treated with tezepelumab (in house) was lower than that in untreated mice. Values are expressed as mean ± SEM. TARC: thymic and activating regulatory chemokine, also known as CCL17 (C-C motif chemokine ligand 17).
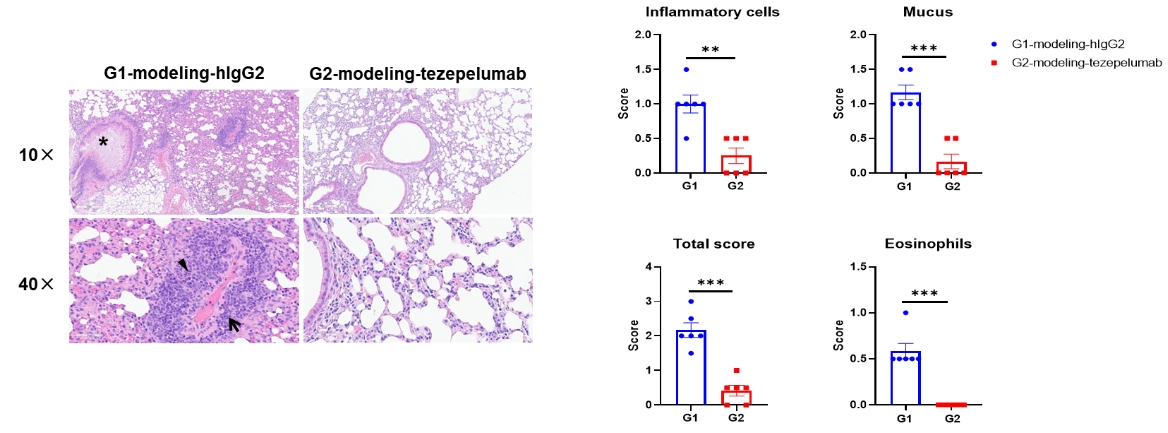
H&E staining of asthma-like model in B-hTSLP/hTSLPR mice plus. Lung tissues were collected at the study endpoint and analyzed with H&E staining. The results showed that compared to the untreated group (G1), the group of mice treated with tezepelumab (in house) showed a significant reduction in inflammatory infiltration and mucus secretion in lung tissue, indicating that B-hTSLP/hTSLPR mice plus provide a powerful preclinical model for in vivo evaluation of anti-human TSLP antibodies. Black arrow: inflammatory cells; black triangle: eosinophils; asterisk: mucus. Values are expressed as mean ± SEM.
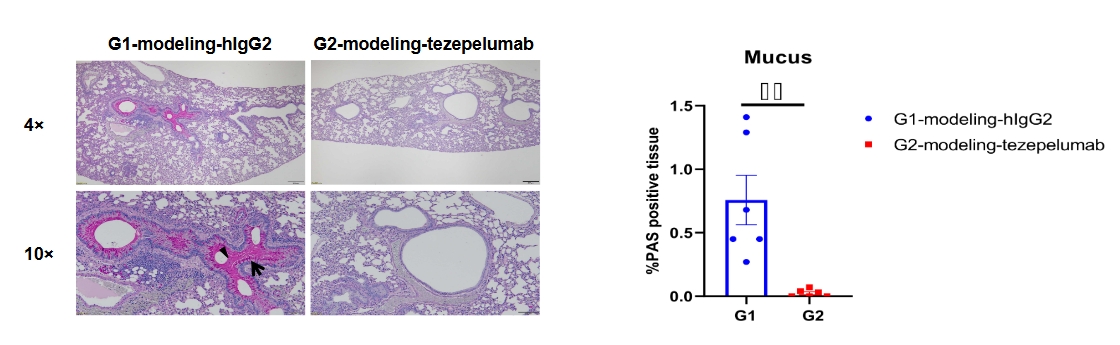
Periodic acid-Schiff (PAS) staining of asthma-like model in B-hTSLP/hTSLPR mice plus. Lung tissues were collected at the study endpoint and analyzed with PAS staining. Compared to the untreated group (G1), the group of mice treated with tezepelumab (in house) showed a significant reduction in mucus secretion in lung tissue. Arrow: goblet cells; Triangle: mucus. Values are expressed as mean ± SEM.
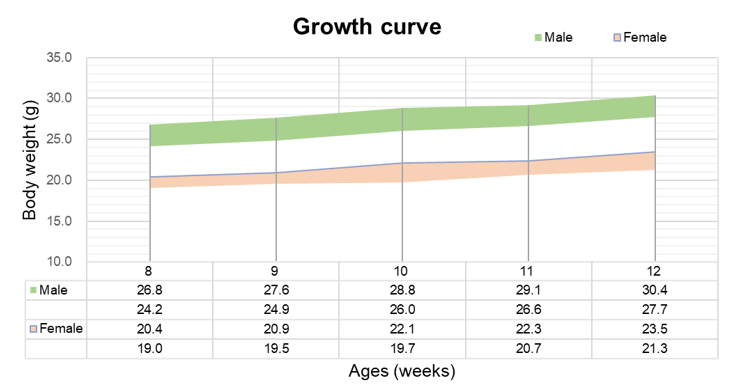
Growth curve of B-hTSLP/hTSLPR mice plus
Eight weeks old of mice were grouped (10 males and 10 females, respectively). Body weight was measured on the same day of every week and lasted for 12 weeks. The lowest and highest values of mouse body weight in the table were calculated from the mean ± SD. The growth curve conforms to the normal distribution and the probability of random error falling within ± SD is 68%.
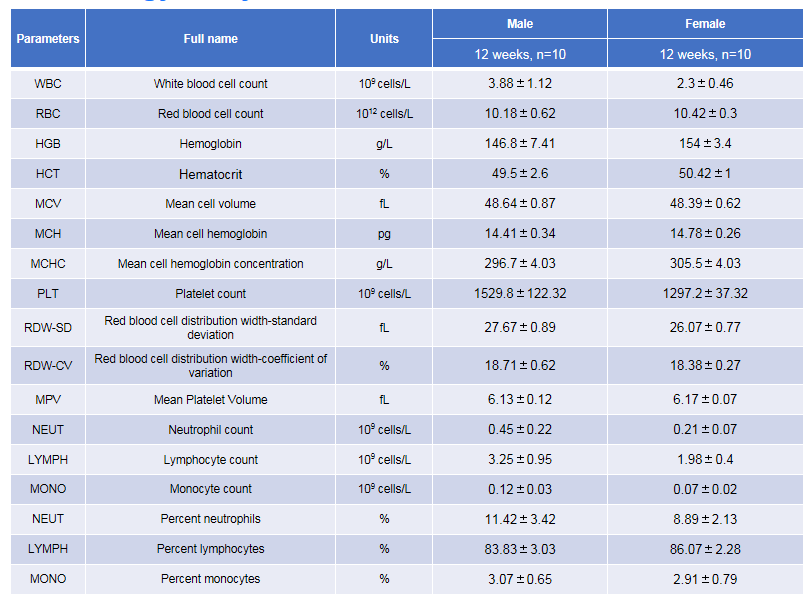
Complete blood count (CBC) of B-hTSLP/hTSLPR mice plus. Values are expressed as mean ± SD.
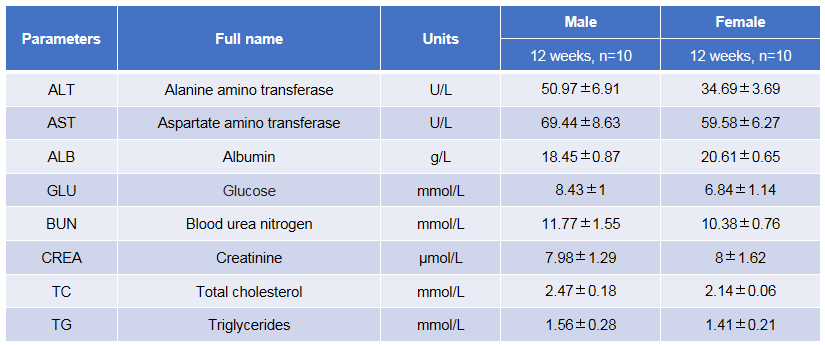
Blood biochemical test of B-hTSLP/hTSLPR mice plus. Values are expressed as mean ± SD.
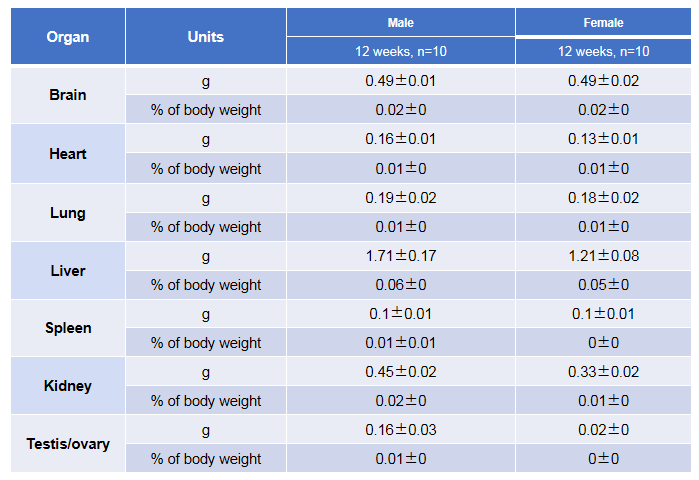
Average weight of the main organs of B-hTSLP/hTSLPR mice plus.
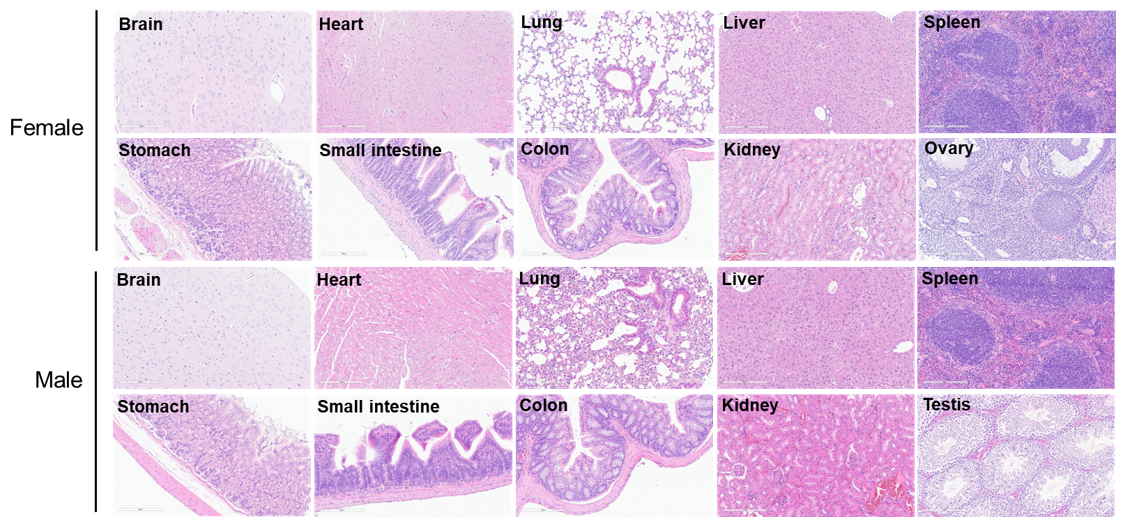
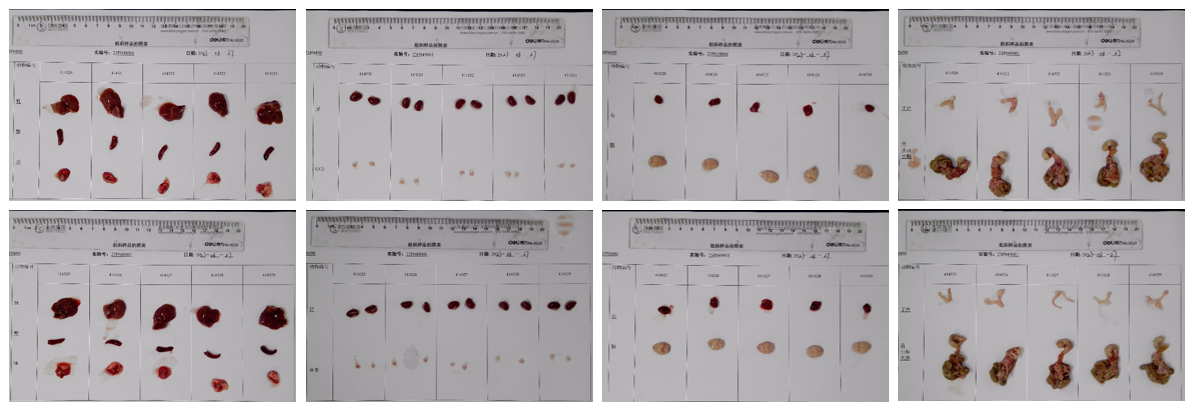
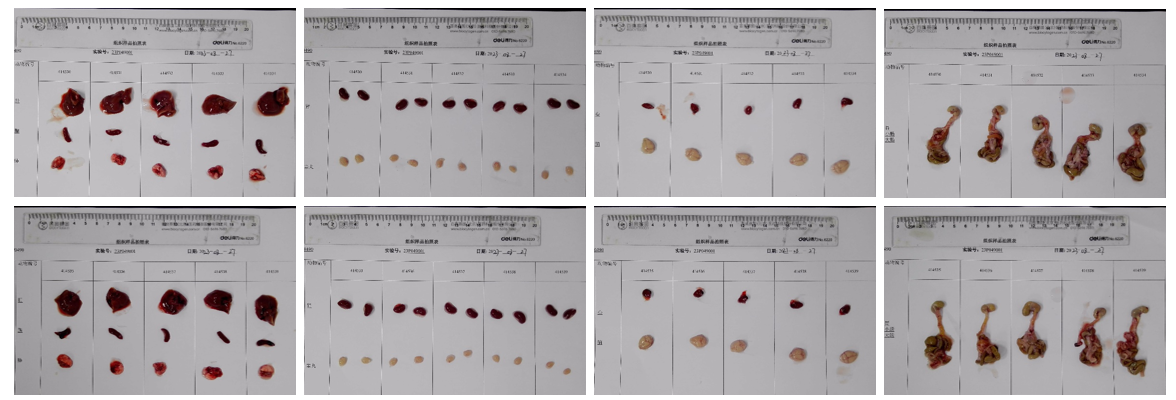
Histopathological analysis of organs in B-hTSLP/hTSLPR mice plus. The main organs of B-hTSLP/hTSLPR mice plus were isolated at 12 weeks of age and analyzed with H&E staining (male, n=10; female, n=10). Results showed that no obvious abnormalities were found in all of the organs (brain, heart, lung, liver, spleen, stomach, small intestine, colon, kidney, ovary, uterus and testis).