C57BL/6-Cd25tm1(CD25)Bcgen/Bcgen • 110066
| Product name | B-hIL2RA mice |
|---|---|
| Catalog number | 110066 |
| Strain name | C57BL/6-Cd25tm1(CD25)Bcgen/Bcgen |
| Strain background | C57BL/6 |
| NCBI gene ID | 16184 (Human) |
| Aliases | IL2RA (interleukin 2 receptor, alpha chain) |
Gene targeting strategy for B-hIL2RA mice. The exons 2-6 of mouse Il2ra gene that encode the extracellular domain were replaced by human IL2RA exons 2-6 in B-hIL2RA mice.
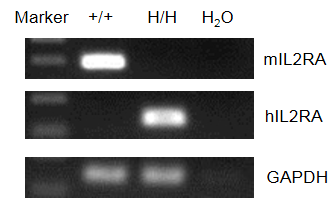
Strain specific analysis of IL2RA gene expression in WT and B-hIL2RA mice by RT-PCR. Mouse Il2ra mRNA was detectable only in splenocytes of wild-type (+/+) mice. Human IL2RA mRNA was detectable only in homozygous B-hIL2RA mice but not in wild-type mice.
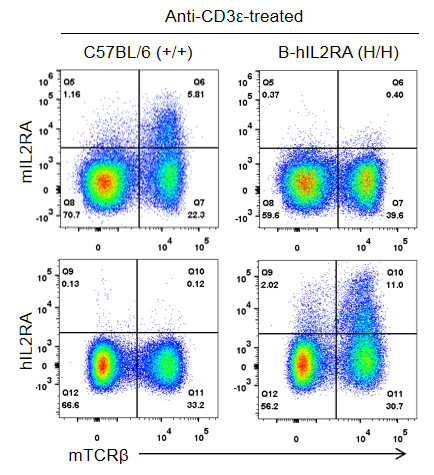
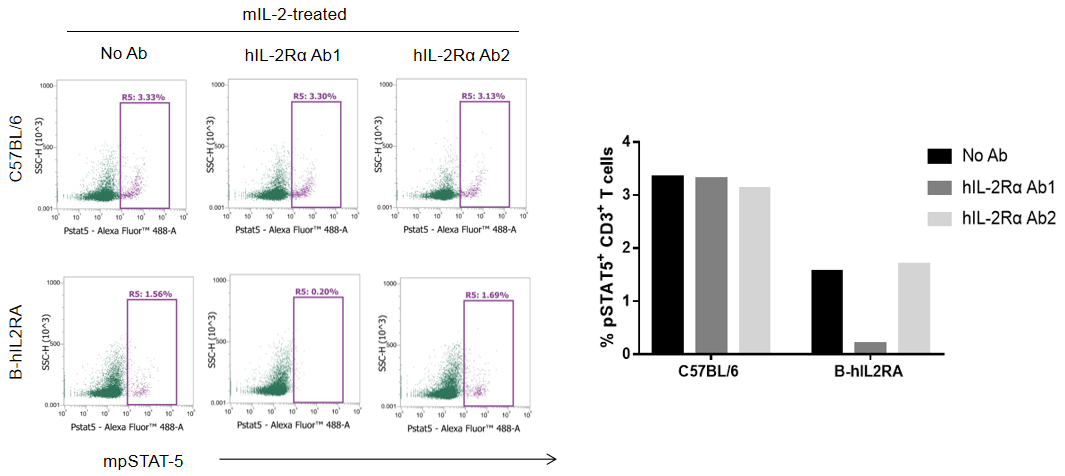
Strain specific IL2RA expression analysis in homozygous B-hIL2RA mice by flow cytometry. Splenocytes were collected from WT mice and homozygous B-hIL2RA (H/H) mice stimulated with anti-CD3ε in vivo, and analyzed by flow cytometry with species-specific anti-IL2RA antibody. Mouse IL2RA was detectable in WT mice. Human IL2RA was exclusively detectable in homozygous B-hIL2RA mice but not in WT mice.
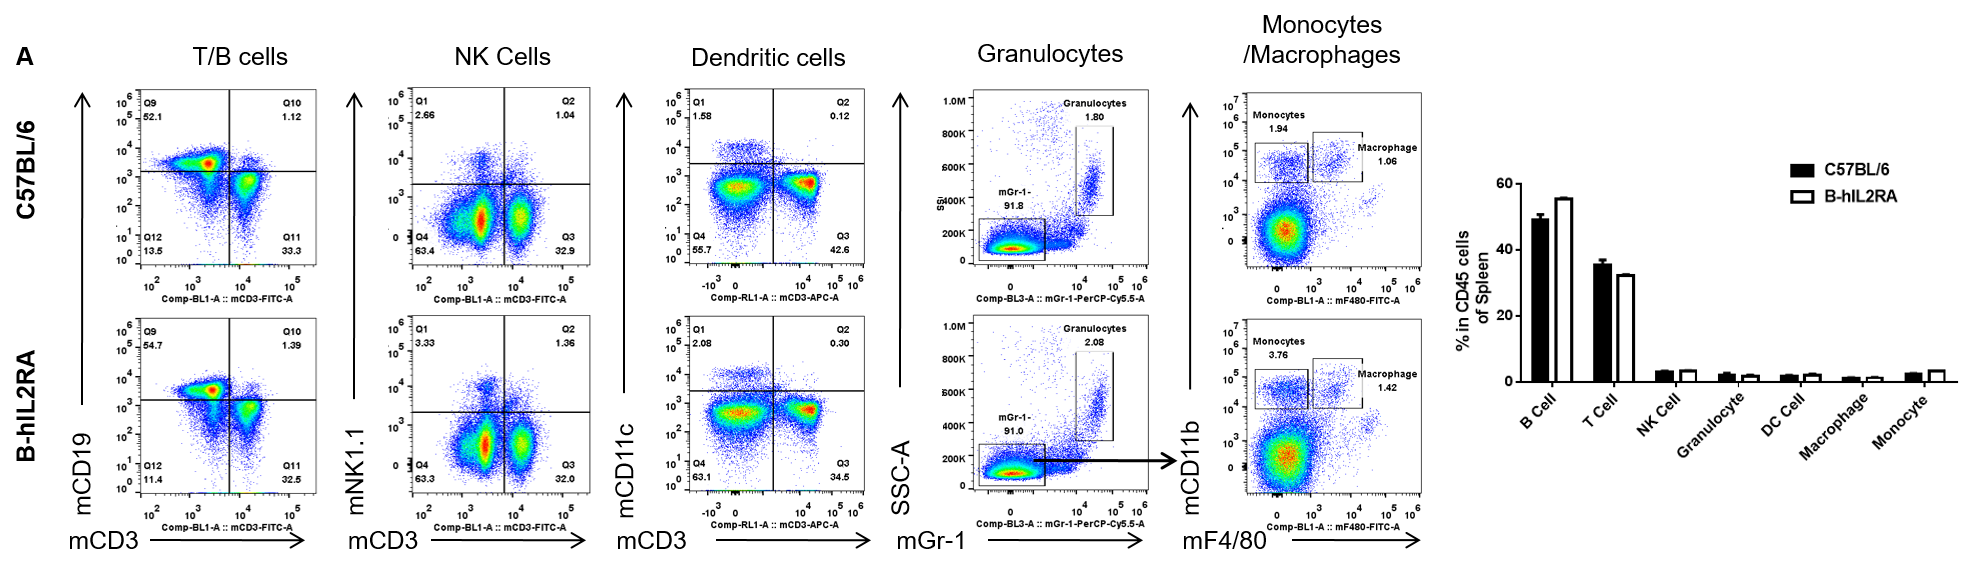
Analysis of spleen leukocyte subpopulations by FACS. Splenocytes were isolated from female C57BL/6 and B-hIL2RA mice (n=3, 6 week-old) Flow cytometry analysis of the splenocytes was performed to assess leukocyte subpopulations. A. Representative FACS plots. Single live cells were gated for CD45 population and used for further analysis as indicated here. B. Results of FACS analysis. Percent of T, B, NK, Monocyte, DC and macrophage cells in homozygous B-hIL2RA mice were similar to those in the C57BL/6 mice, demonstrating that introduction of hIL2RA in place of its mouse counterpart does not change the overall development, differentiation or distribution of these cell types in spleen.
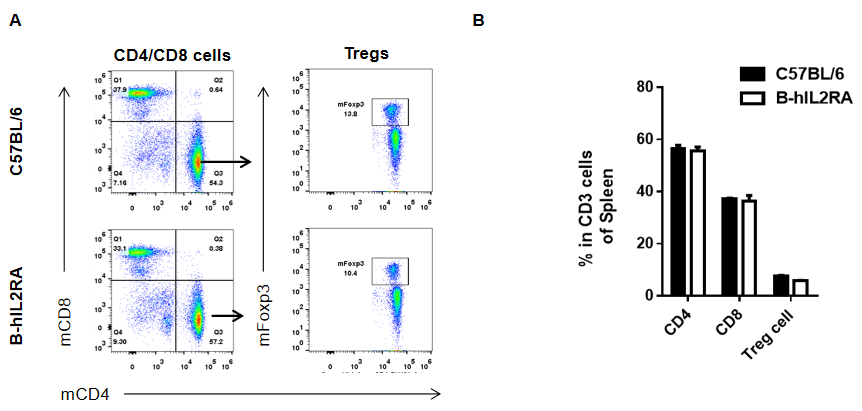
Analysis of spleen T cell subpopulations by FACS. Splenocytes were isolated from female C57BL/6 and B-hIL2RA mice (n=3, 6 week-old). Flow cytometry analysis of the splenocytes was performed to assess leukocyte subpopulations. A. Representative FACS plots. Single live CD45+ cells were gated for CD3 T cell population and used for further analysis as indicated here. B. Results of FACS analysis. Percent of CD8, CD4, and Treg cells in homozygous B-hIL2RA mice were similar to those in the C57BL/6 mice, demonstrating that introduction of hIL2RA in place of its mouse counterpart does not change the overall development, differentiation or distribution of these T cell sub types in spleen. Values are expressed as mean ± SEM.
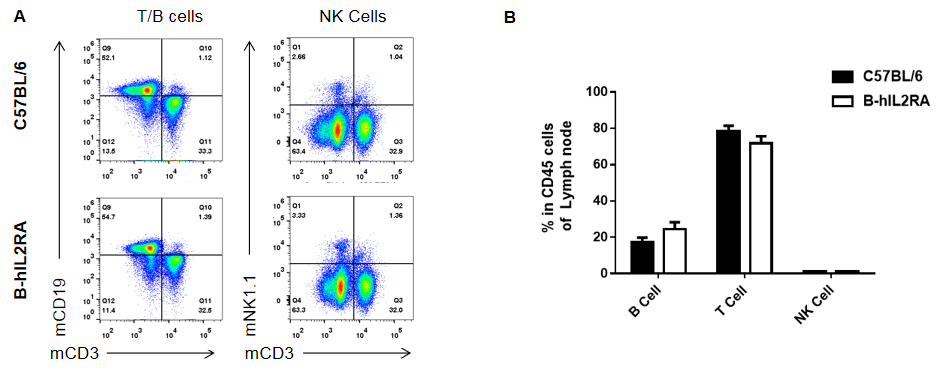
Analysis of lymph node leukocyte subpopulations by FACS. Leukocytes were isolated from female C57BL/6 and B-hIL2RA mice (n=3, 6 week-old) Flow cytometry analysis of the leukocytes was performed to assess leukocyte subpopulations. A. Representative FACS plots. Single live cells were gated for CD45 population and used for further analysis as indicated here. B. Results of FACS analysis. Percent of T, B and NK cells in homozygous B-hIL2RA mice were similar to those in the C57BL/6 mice, demonstrating that introduction of hIL2RA in place of its mouse counterpart does not change the overall development, differentiation or distribution of these cell types in lymph node.
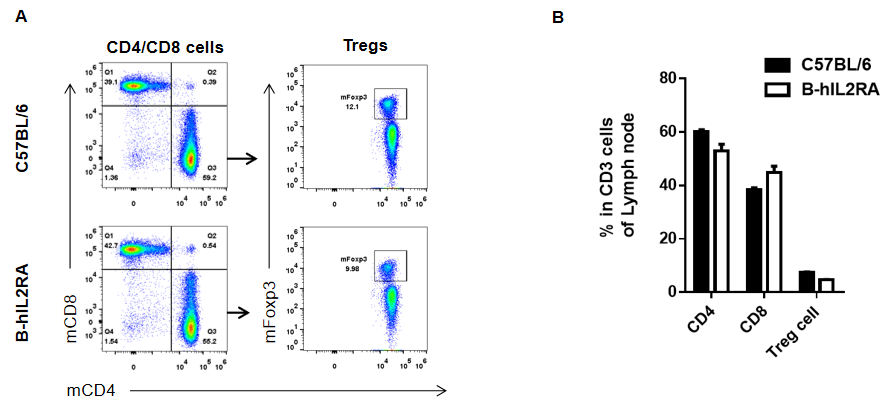
Analysis of lymph node T cell subpopulations by FACS. Leukocytes were isolated from female C57BL/6 and B-hIL2RA mice (n=3, 6 week-old). Flow cytometry analysis of the leukocytes was performed to assess leukocyte subpopulations. A. Representative FACS plots. Single live CD45+ cells were gated for CD3 T cell population and used for further analysis as indicated here. B. Results of FACS analysis. Percent of CD8, CD4, and Treg cells in homozygous B-hIL2RA mice were similar to those in the C57BL/6 mice, demonstrating that introduction of hIL2RA in place of its mouse counterpart does not change the overall development, differentiation or distribution of these T cell sub types in lymph node. Values are expressed as mean ± SEM.
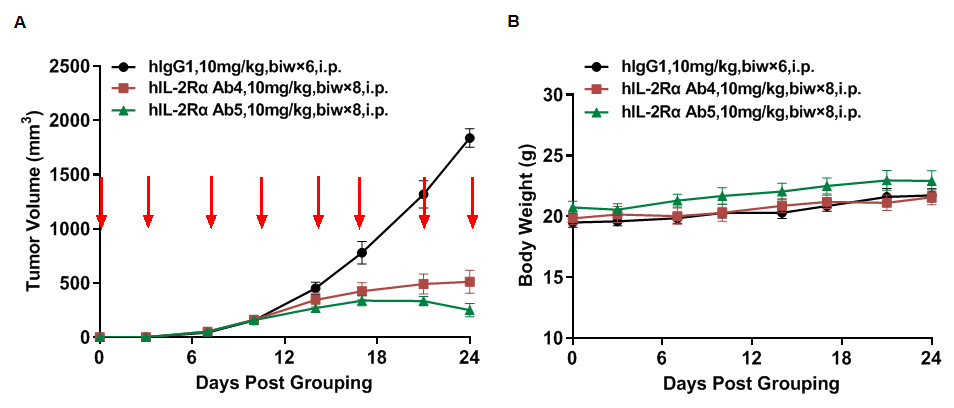
Antitumor activity of anti-human IL2RA antibodies in B-hIL2RA mice. (A) Anti-human IL2RA antibodies inhibited MC38 tumor growth in B-hIL2RA mice. Murine colon cancer MC38 cells were subcutaneously implanted into homozygous B-hIL2RA mice (female, 6-7 week-old, n=5). Mice were grouped according to body weight differences, at which time they were treated with anti-hIL2RA Ab4 and Ab5 with doses and schedules indicated with red arrows in panel A. (B) Body weight changes during treatment. As shown in panel A, anti-human IL2RA antibodies were efficacious in controlling tumor growth in B-hIL2RA, demonstrating that the B-hIL2RA mice provide a powerful preclinical model for in vivo evaluation of anti-human IL2RA antibodies. Values are expressed as mean ± SEM. (All antibodies were made in house)
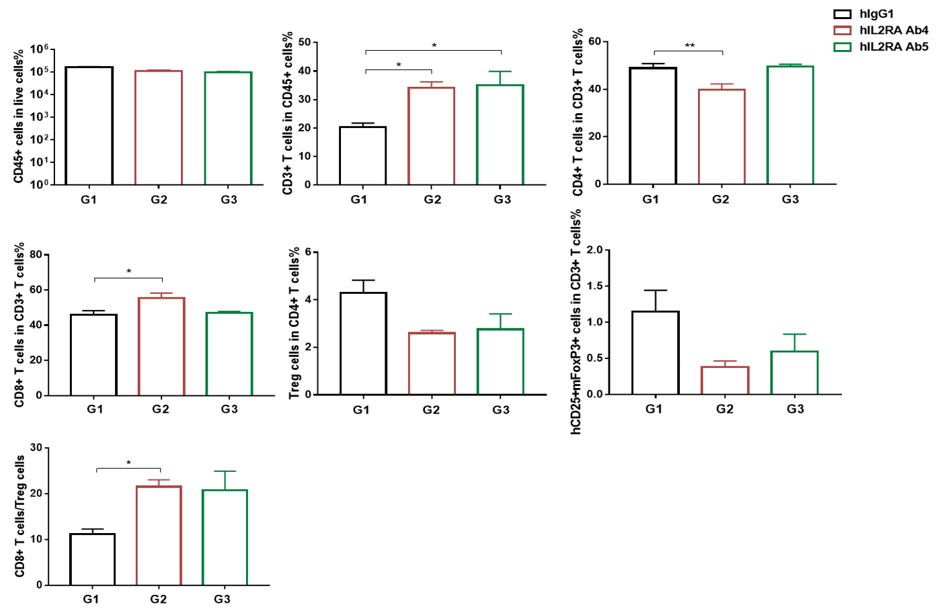
Flow cytometry analysis of blood lymphocytes. Blood were harvested at the endpoint of experiment (n=5). Flow cytometry analysis of the lymphocytes were performed to assess cell number and proportion changes compared to the group with no anti-hIL2RA antibody treated. CD4+ T cells were significantly reduced when treated with anti-hIL2RA antibodies, while the ratio of CD8+ T cells/Treg cells were significantly increased in the group treated with anti-hIL2RA Ab4 compared to the hIgG1. Values are expressed as mean ± SEM.
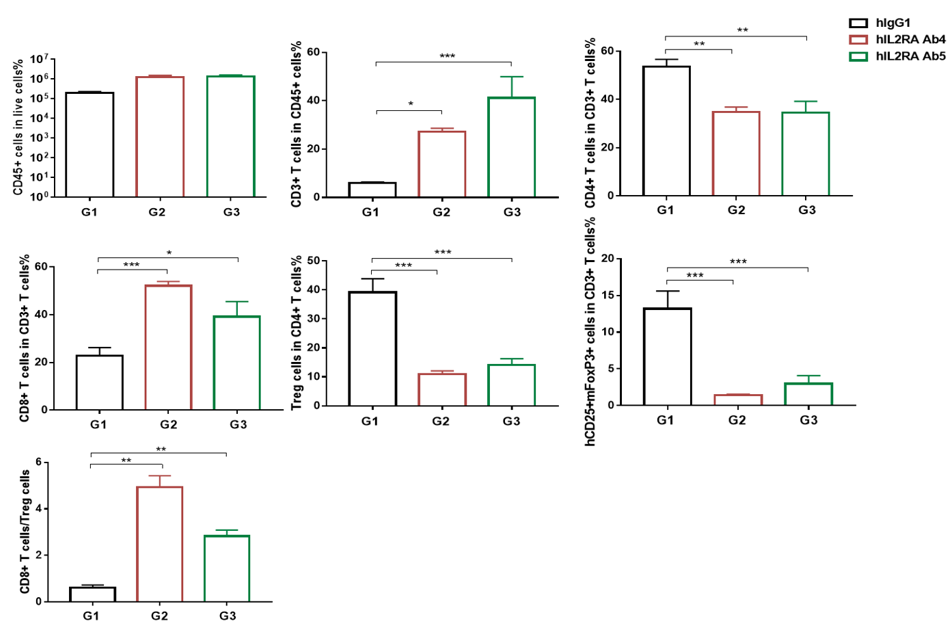
Flow cytometry analysis of tumor infiltrating lymphocytes (TILs). Tumor cells were harvested at the endpoint of experiment (n=5). Flow cytometry analysis of the lymphocytes were performed to assess cell number and proportion changes compared to the group with no anti-hIL2RA antibody treated. CD4+ T cells, Treg cells and hCD25+ mFoxP3+ T cells were significantly reduced when treated with anti-hIL2RA antibodies, while the ratio of CD8+ T cells/Treg cells were significantly increased in the all groups treated with anti-hIL2RA antibodies compared to the hIgG1. Values are expressed as mean ± SEM.
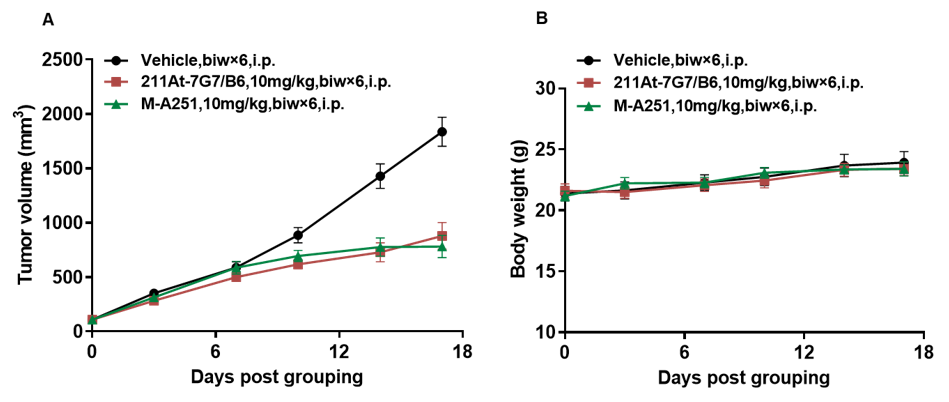
Antitumor activity of anti-human IL2RA antibodies in B-hIL2RA mice. (A) Anti-human IL2RA antibodies inhibited MC38 tumor growth in B-hIL2RA mice. Murine colon cancer MC38 cells were subcutaneously implanted into homozygous B-hIL2RA mice (female, 6-7 week-old, n=8). Mice were grouped according to body weight differences, at which time they were treated with four anti-human IL2RA antibodies with doses. (B) Body weight changes during treatment. As shown in panel A, anti-human IL2RA antibodies (211At-7G7/B6 and M-A251) were efficacious in controlling tumor growth in B-hIL2RA, demonstrating that the B-hIL2RA mice provide a powerful preclinical model for in vivo evaluation of anti-human IL2RA antibodies. Values are expressed as mean ± SEM. (All antibodies were made in house)